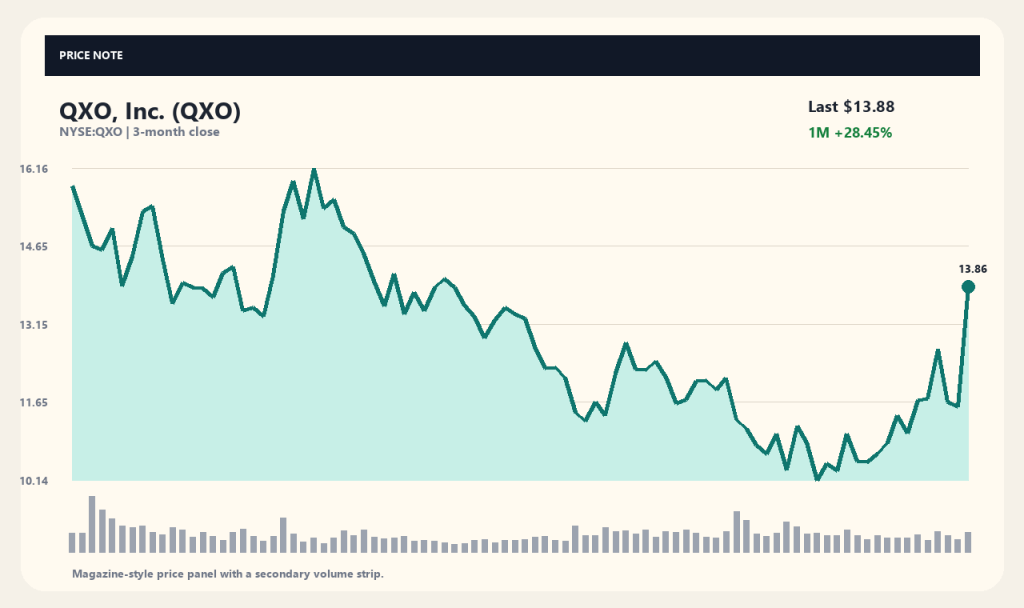
Shares of QXO, a building products distributor listed on the New York Stock Exchange, recently experienced significant volatility, capturing market attention after jumping more than 20% in a single day around its third-quarter preliminary earnings release.
This recent price action goes beyond a simple rally, aligning closely with the preliminary financial figures disclosed by the company, with investors closely watching the specific metrics ahead of the official third-quarter earnings report.
Building Products Distribution and Q3 Preliminary Results
QXO is a distributor specializing in roofing, siding, insulation, and various other building products, primarily operating across the United States and Canada to supply residential and commercial construction needs with leading brand products.
According to recent reports covering the third-quarter preliminary results, the company showed revenue growth alongside a slightly narrowed net loss, with foreign media outlets like MT Newswires noting that these signs of improving performance influenced the stock surge.
Recent Stock Performance and Price Levels
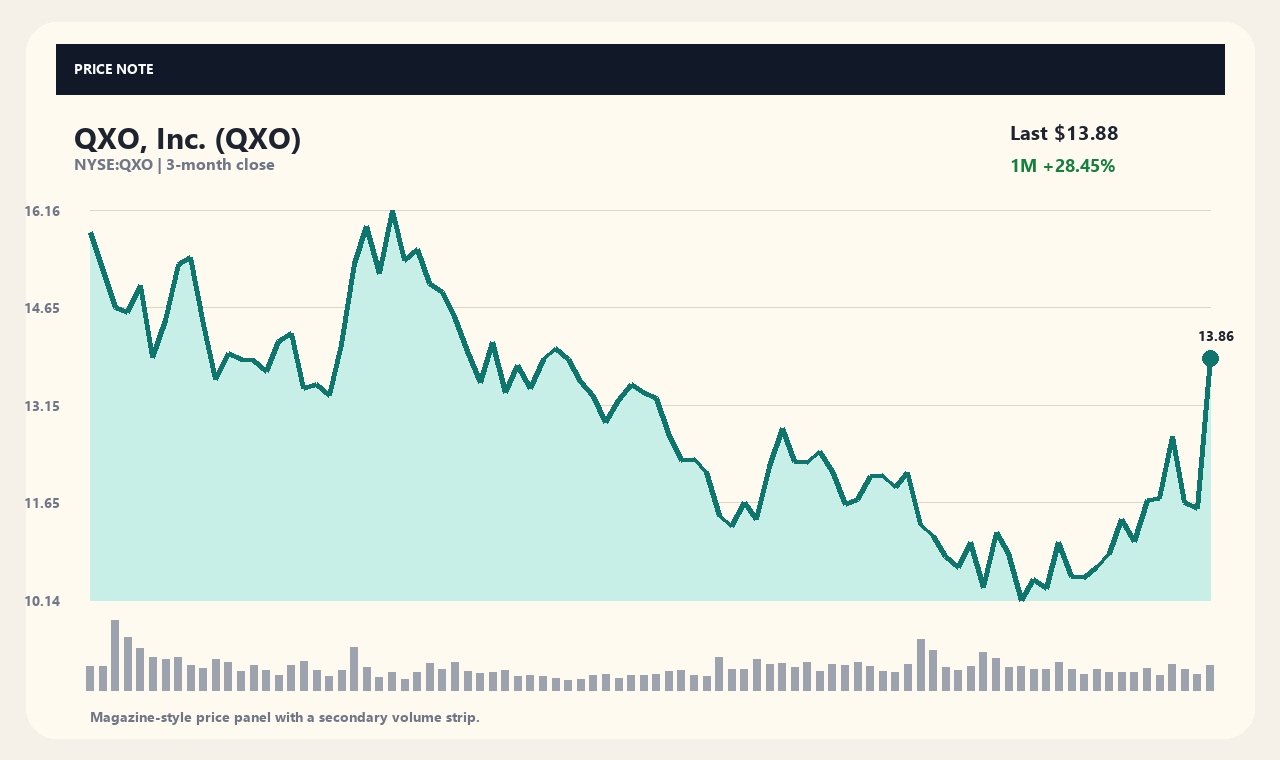
Based on Yahoo Chart API data, QXO shares reached $13.88, marking a 20.11% increase from the previous close of $11.56, while posting gains of 18.88% over the past week and 28.45% over the past month.
However, the stock remains down 10.71% over a three-month period, reflecting an overlap between a short-term rebound and an ongoing medium-term correction trend, with the current price sitting at roughly 21.88% of its 52-week high of $27.61.
Moving Averages and Trading Volume Trends
Looking at moving averages, the stock currently trades above both its 20-day moving average of $11.17 and its 60-day moving average of $12.08, with a 24.33% gap from the 20-day line highlighting strong short-term upward momentum.
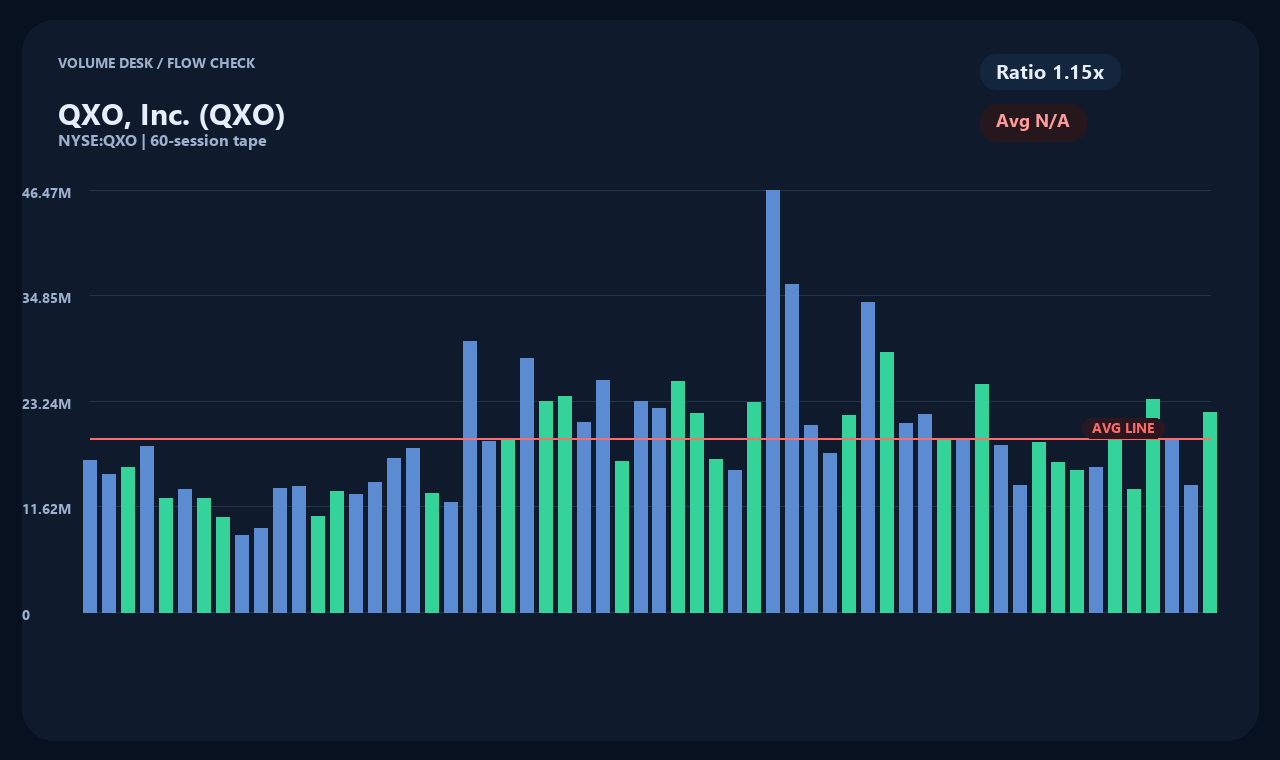
Trading volume also increased above normal levels, recording a volume ratio of 1.15, though this volume expansion does not directly prove a net buying advantage or a larger investor base, but rather highlights heightened market attention around the earnings release.
Financial Structure and Profitability Limitations
According to Yahoo Finance company summaries, QXO total revenue reaches approximately $9.898 billion, yet the company continues to post a net loss of roughly $656.3 million alongside negative earnings per share.
Operating cash flow recorded a positive inflow of $253.4 million, but free cash flow stands at a negative $2.546 billion, and with total debt exceeding $7 billion, detailed financial metrics and the timing of a profitability recovery require ongoing monitoring.
Conditions That Could Alter Future Outlook
Whether this stock surge and preliminary earnings release will translate into long-term fundamental improvement must be verified through upcoming official earnings filings, and determining whether revenue growth and reduced losses are sustainable trends requires watching shifts in the debt structure and cash flows.
Market participants are expected to evaluate whether the company is genuinely improving profitability by reviewing upcoming official quarterly reports and management commentary during earnings calls.
As of collection time (2026-11-10T04:02:25): Price $13.88 · 1-Day 20.11% · 1-Week 18.88% · 1-Month 28.45% · 3-Month -10.71%
[Sources and Verification Time]
Market Data: yahoo_chart_api · Verification Time: 2026-11-10T04:02:25. Related coverage sources: Motley Fool, Zacks, MT Newswires. Article titles serve as clues for fact-checking, and primary sources such as corporate announcements and filings should be independently reviewed.
This article is provided for informational purposes only and does not constitute investment advice.
This content is for informational purposes only and is not investment advice.

