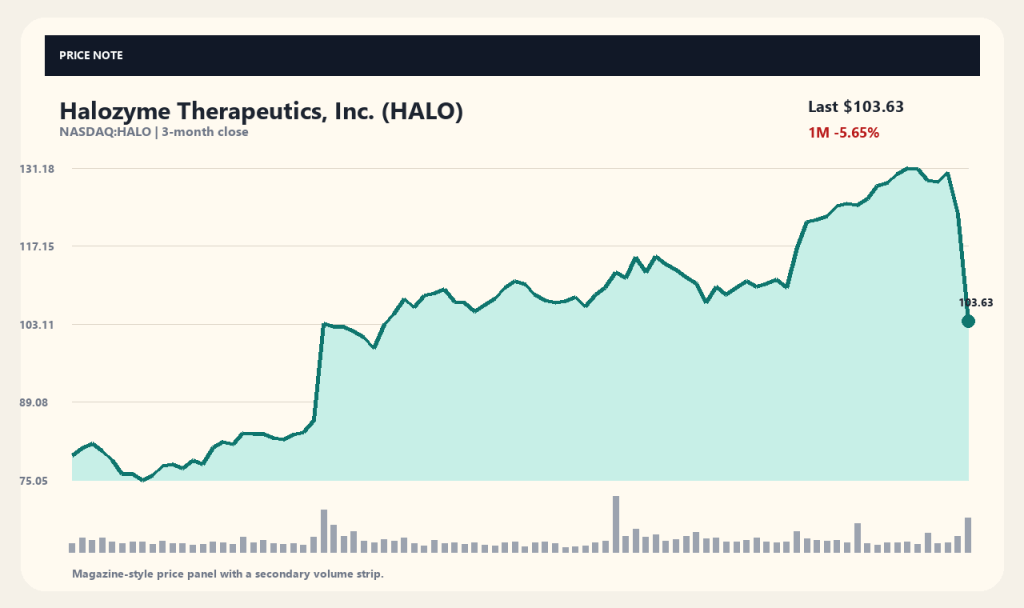
In its recent third-quarter financial results, US biopharmaceutical company Halozyme Therapeutics reported strong year-over-year revenue and net income growth. Along with this performance, the company announced that a new drug utilizing its proprietary technology received approval from the US Food and Drug Administration, though its stock experienced a short-term pullback.
Investors have offered various interpretations regarding why the stock declined despite positive catalysts such as solid earnings and regulatory approval. It is necessary to examine specific metrics to understand the context behind the divergence between the company's operational performance and its market price reaction.
Third-Quarter Earnings and Revenue Growth Trends
According to Halozyme Therapeutics' third-quarter financial disclosures, the company achieved clear revenue growth driven by robust sales of key products and higher royalty revenues. Multiple media outlets and securities reports noted that earnings for the quarter exceeded market expectations.
However, immediately following this financial announcement, the stock dropped by approximately 15.72 percent over a one-day period and traded lower by about 20.84 percent over a one-week span. Despite the company's solid financial metrics, the backdrop of broader market conditions or elevated stock positioning likely contributed to this sharp short-term price movement.
US FDA Drug Approval and Technology Application Scope
Alongside its earnings release, the company announced that Rybrevant Faspro gained US FDA approval as a treatment for advanced head and neck cancer. This medication was co-formulated into a subcutaneous injection utilizing the company's core ENHANZE drug delivery technology to improve patient convenience.
Such regulatory approval is viewed as a supportive factor for the company's long-term growth momentum and royalty-based revenue model. Nevertheless, positive regulatory news for an individual company failed to immediately reverse the downward stock trend, and observers note that the timeline for actual revenue contributions from commercialization requires further monitoring.
Structural Characteristics of Stock Price and Volume Volatility
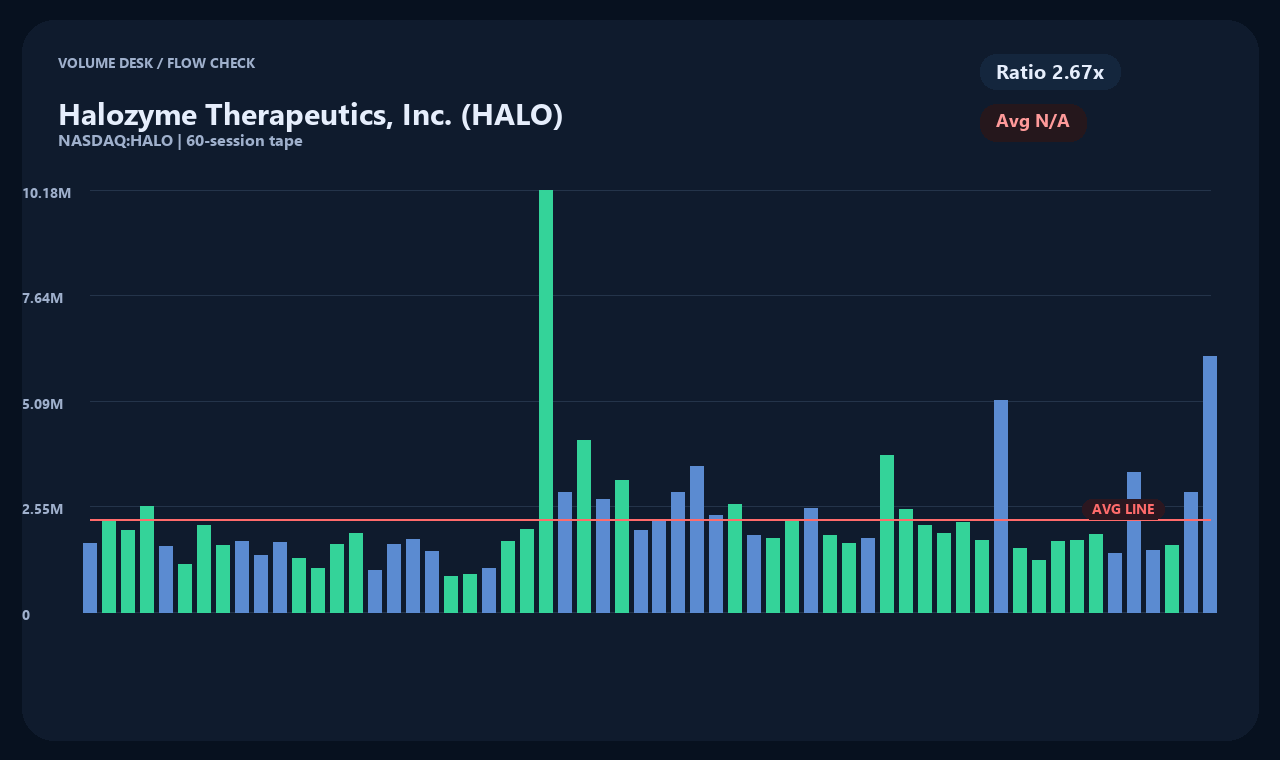
During recent trading sessions, trading volume for Halozyme Therapeutics significantly exceeded its daily average, reflecting high market attention. The stock has undergone a correction near its 52-week high and is currently trading below its 20-day and 60-day moving averages.
The combination of increased volume and falling prices indicates that selling pressure was concentrated or that short-term profit-taking movements predominated. Rather than a simple negative catalyst, this price and volume action can be interpreted as a shift in supply and demand dynamics and an adjustment of market participant expectations around the earnings release.
Evaluation of Drug Pricing Policy Uncertainty
Management reaffirmed its stance that the final regulations of the recent Medicare drug price negotiation program will have a limited impact on future royalty revenues. Executives projected that any hit to royalty income through 2035 would be minimal or negligible, seeking to mitigate policy risks.
Despite the company's official position on institutional changes, policy uncertainty remains a sensitive point watched closely by market participants from a long-term investment perspective. How regulatory changes will actually impact the company's cash flow must be verified through the ongoing policy implementation process.
Core Conditions for Future Reassessment
To interpret the gap between the recent stock decline and the earnings release, it is necessary to check whether royalty revenues continue to grow steadily in forthcoming quarterly results. Key criteria include the materialization of sales from commercialized drugs and the complete resolution of concerns regarding regulatory risks.
In addition, investors should verify whether pipelines incorporating the company's core technology translate into stable cash generation, moving beyond short-term supply and demand fluctuations. Objectively grasping the underlying financial health and growth rate behind the stock volatility is a crucial requirement for understanding the current market environment.
As of retrieval time (2026-11-09T04:02:23): Price 103.63USD · 1-Day -15.72% · 1-Week -20.84% · 1-Month -5.65% · 3-Months 0.98%
[Sources and Verification Timing]
Market data: yahoo_chart_api · Verification time: 2026-11-09T04:02:23. Related news source: Additional verification required for related news. Article titles serve as factual reference points, and primary sources such as company disclosures and announcements should be checked independently.
This content is for informational purposes and does not constitute investment advice.
This content is for informational purposes only and is not investment advice.

