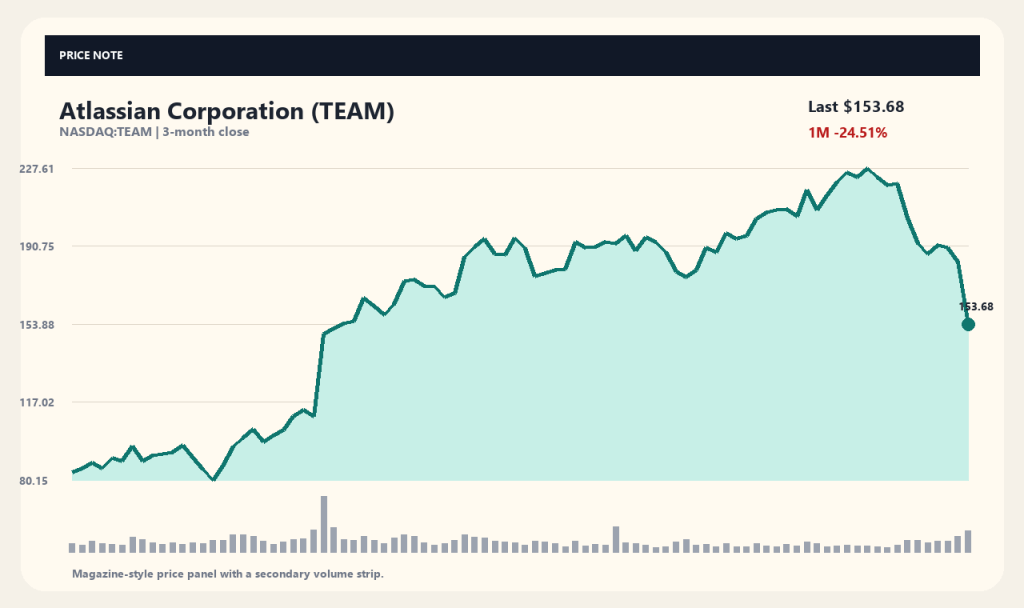
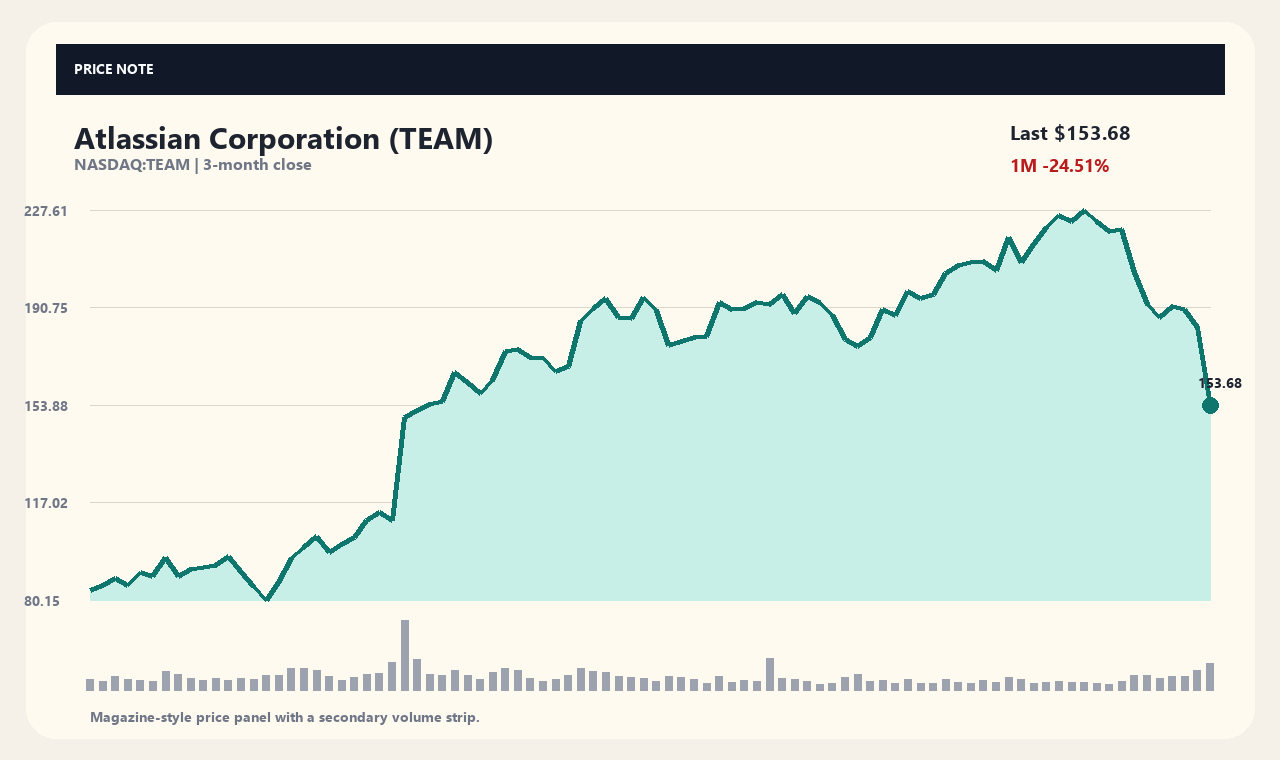
Atlassian Corporation (TEAM) stock dropped 16.15% in a single trading session to close at $153.68. The sharp correction from its previous close of $183.29 coincided with the release of the company's Q1 financial results and full-year business outlook. Market participants are closely evaluating the tension between strong quarterly performance figures and guidance pointing toward a potential deceleration in near-term growth.
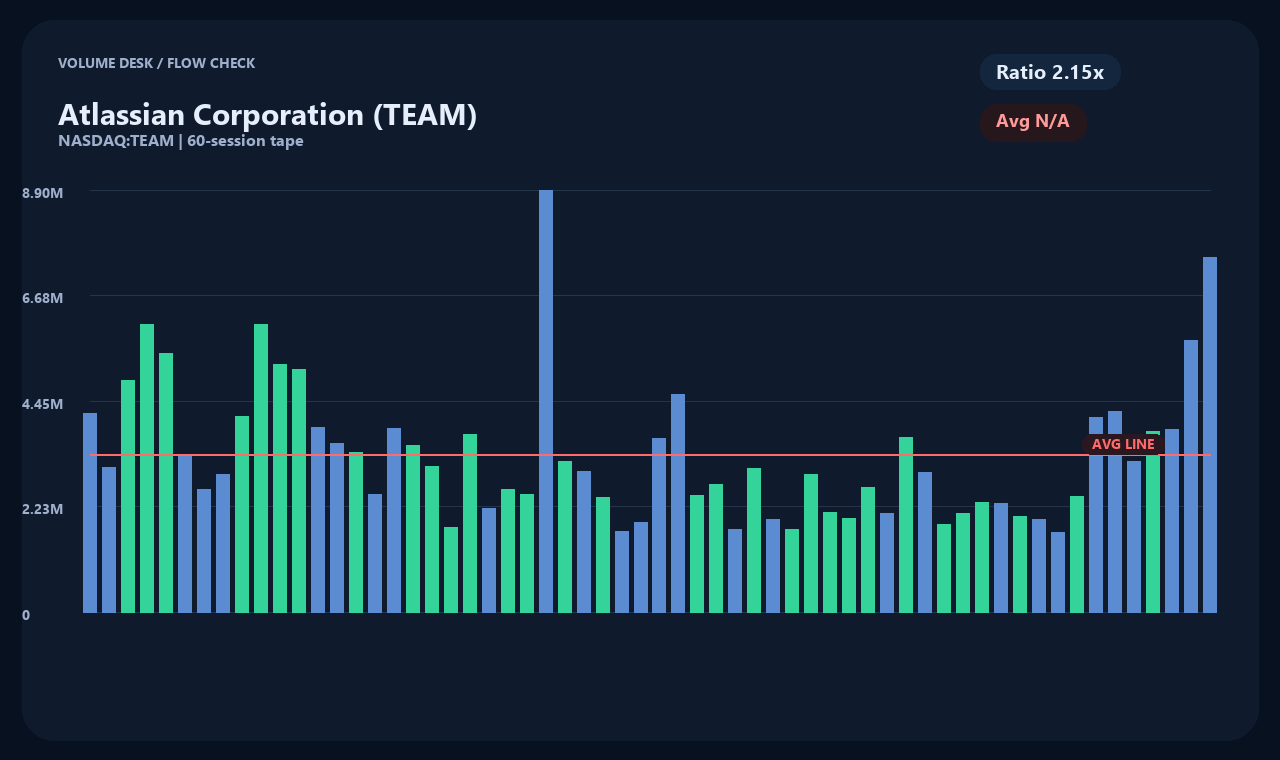
2. PARA: Trading volume surged to approximately 7.47 million shares during the session, representing a 2.15-fold increase over its recent average daily volume of 3.47 million shares. Short-term price volatility has expanded notably, with the stock falling 19.84% over the past week and posting a 1-month return of -24.51%. Relative to its 52-week range of $56.01 to $229.96, the current stock price sits at the 56.15th percentile and trades at a -25.42% discount to its 20-day moving average.
Quarterly Revenue Growth and Forward Guidance Overview
According to Atlassian's Q1 fiscal year 2027 financial report, quarterly revenue rose 23.71% year-over-year to $1.77 billion. GAAP earnings per share (EPS) came in at $1.65, representing a 58.65% increase compared to the prior-year period. Top-line expansion driven by core operations maintained solid momentum, supported by sustained demand across existing product suites and ongoing cloud migration initiatives.
However, management set its full-year fiscal 2027 revenue growth target at approximately 13.75%. Because this annual trajectory trails the Q1 growth rate of 23.71%, investors interpreted the outlook as a signal that quarterly revenue expansion could slow over the remainder of the year. According to coverage from media outlets including MT Newswires, the stock's negative market reaction reflects caution surrounding the forward outlook despite the strong quarterly beats.
Stock-Based Compensation Scale and Financial Metrics Summary
Detailed financial items disclosed alongside the earnings release show Q1 stock-based compensation (SBC) expense totaled approximately $356.50 million. This SBC figure exceeded the company's GAAP operating income of $188.80 million over the same period. Additionally, share repurchases reached approximately $588.00 million during the quarter, highlighting key baseline metrics when evaluating net cash generation.
Based on corporate financial summary data, trailing twelve-month (TTM) total revenue stands at approximately $6.9119 billion, with net income attributable to controlling shareholders reaching $88.76 million. Operating cash flow totaled approximately $1.69295 billion, while free cash flow reached $2.01243 billion. Balance sheet data indicates cash and cash equivalents of $1.1205 billion against total debt of $1.22696 billion.
Product Portfolio and Position in Collaborative Software
Founded in 2002 and headquartered in Sydney, Australia, Atlassian develops software designed to streamline team collaboration and organizational productivity. Its flagship offerings include project management tool Jira, documentation platform Confluence, and video messaging service Loom. The company also operates a diverse suite of products including Trello, Bitbucket, Jira Service Management, and Rovo.
Delivered primarily via cloud platforms, these products serve to connect workflows across software development, IT service management, and product management teams. As with most enterprise software vendors, the cloud adoption rate and expansion within existing accounts serve as major catalysts for long-term revenue. In the latest earnings report, maintaining momentum in the cloud segment remained a central focal point for market analysts.
Moving Average Technical Levels and Historical Price Positioning
The current price of $153.68 reflects substantial downside divergence relative to key historical moving averages. The stock trades 25.42% below its 20-day moving average of $206.06 and 19.81% below its 60-day moving average of $191.65. This shift beneath major moving average lines marks a distinct technical breakdown on short-term charts.
Nevertheless, moving averages represent simple arithmetic calculations of historical trading prices and do not guarantee future returns or price directional momentum. In contrast to the short-term declines over the 1-week (-19.84%) and 1-month (-24.51%) periods, the 3-month performance remains positive at 1.19%. When evaluating price positioning, market participants often weigh technical metrics alongside underlying financial results.
Key Forward Looking Catalysts and Investment Considerations
Going forward, a key metric for evaluating Atlassian's trajectory will be whether quarterly cloud revenue growth can track near the upper end of company guidance. Given that market caution stemmed from deceleration concerns in the annual outlook, upcoming results will need to demonstrate whether quarterly performance can beat or maintain the 13.75% full-year target. Additionally, the ratio of stock-based compensation relative to operating income will remain a key structural metric to monitor.
The balance between share buyback programs and organic free cash flow generation will also serve as an important factor in assessing balance sheet stability. How the gap between strong Q1 results and conservative full-year guidance is resolved in upcoming quarterly reports will likely shape valuation multiples. Investors should look beyond short-term price volatility and continue monitoring objective financial disclosures and reported fundamental data.
Market data snapshot as of capture time (2026-11-08T04:02:20): Price $153.68 USD · 1D -16.15% · 1W -19.84% · 1M -24.51% · 3M 1.19%
Sources and Verification Timestamp
Market data: yahoo_chart_api · Timestamp: 2026-11-08T04:02:20. Related media sources: Related coverage requires additional verification. Article headlines serve as leads for fact-checking; primary source documents such as company press releases and official regulatory filings should be independently verified.
This content is provided for informational and educational purposes only and does not constitute investment advice or a solicitation to buy or sell securities.
This content is for informational purposes only and is not investment advice.

