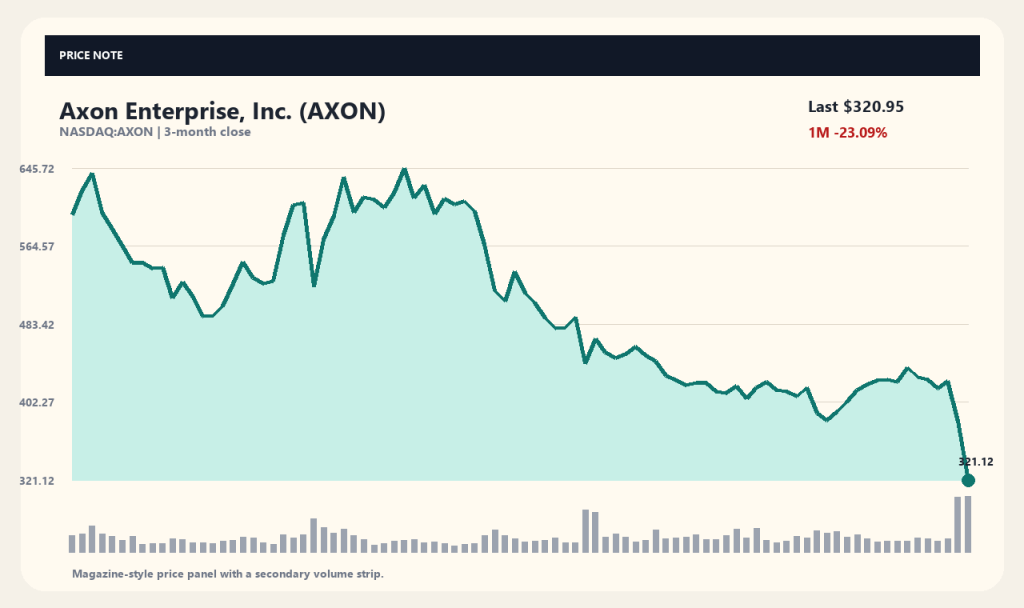
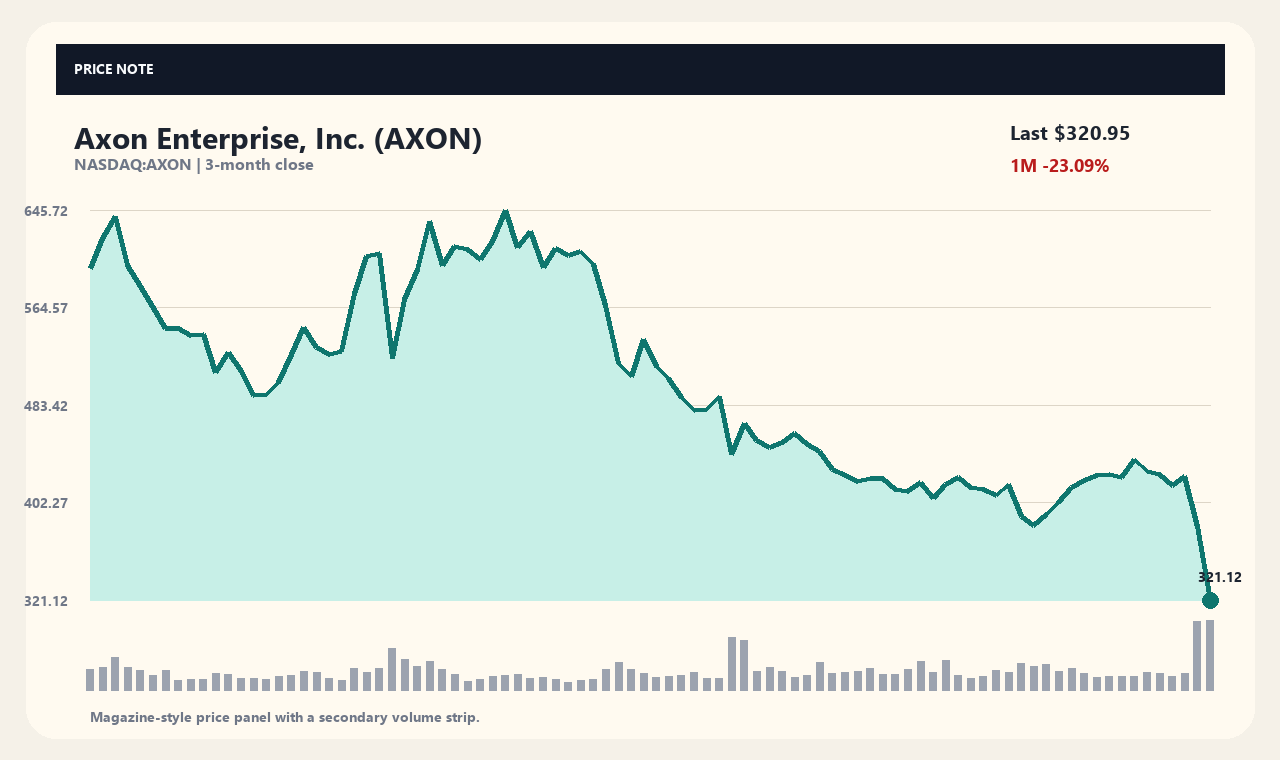
Shares of public safety technology solutions provider Axon Enterprise experienced sharp downside pressure recently. The stock closed at $320.95 in the previous trading session, down 16.1% for the day, with cumulative losses reaching 24.97% over one week and 23.09% over one month.
Over a three-month horizon, the stock has fallen 46.18%, leaving it near its 52-week low at roughly 3.9% relative to its 52-week high of $665.07. As short-term selling pressure intensifies, market participants are weighing the implications of the latest earnings release and shifting business dynamics.
Q3 Earnings Miss and Slowing Revenue Growth
First, third-quarter financial results failed to meet Wall Street expectations. Major financial media and equity research reports indicate that Axon Enterprise delivered Q3 top- and bottom-line figures below consensus estimates alongside margin compression.
Weaker-than-expected revenue growth and profitability metrics eroded investor sentiment rapidly. In particular, management's downward revision to forward guidance heightened concerns over short-term growth catalysts, driving further stock price depreciation.
Federal Contract Delays and Skydio Investment Plans
A second key headwind stems from delayed federal contracts and large-scale capital allocation plans. Reports suggest that deferred deals and contract executions at the federal level hindered timely revenue recognition, directly contributing to the quarterly miss.
At the same time, news of significant investment commitments related to Skydio drew mixed reactions regarding capital deployment and near-term financial burden. Long-term strategic investments in public safety and drone technology are currently viewed as near-term cost overhead.
Technical Indicators and Moving Average Divergence
Third, technical indicators reflect significant downside pressure relative to historical trends. The stock trades well below its 20-day moving average of $408.32 and 60-day moving average of $470.64, representing negative spreads of 21.4% and 31.81%, respectively.
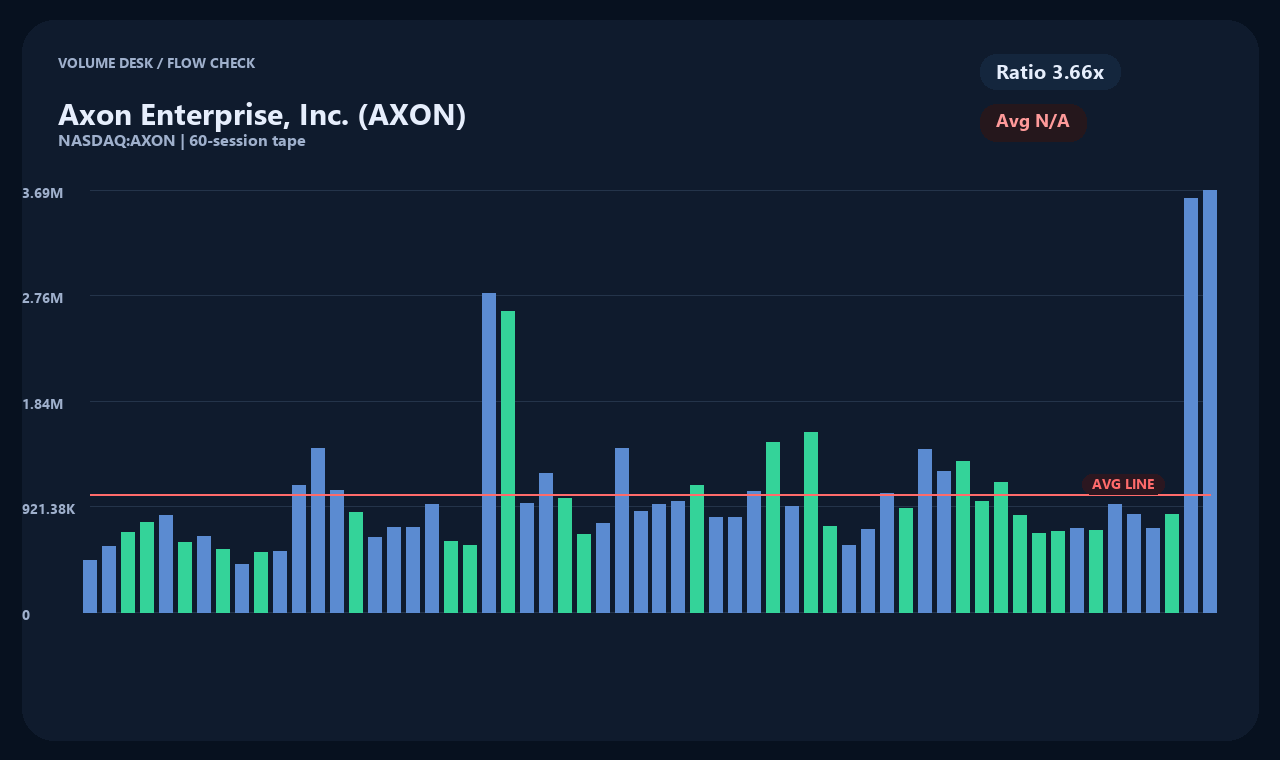
Trading activity surged to over 3.67 million shares—3.66 times average volume—highlighting elevated volatility. However, this volume spike and moving average divergence do not automatically signal a technical bounce or buying opportunity, as they primarily reflect concentrated supply output during the sell-off.
Wall Street Target Price Cut and Limited Earnings Visibility
Fourth, major financial institutions have revised their outlooks and price targets downward. Following the earnings report, several brokerages, including UBS, lowered their price targets on Axon Enterprise or adjusted their ratings to adopt a more cautious stance.
It remains unclear whether federal contract delays represent a temporary timing issue or a multi-quarter overhang. Reduced earnings visibility combined with institutional price target cuts continues to fuel market caution.
Key Catalysts and Factors to Monitor Moving Forward
Finally, several operational milestones will determine whether the fundamental thesis can reset. A primary benchmark is whether delayed federal contracts materialize into recognized revenue in upcoming quarterly filings.
Additionally, investors must monitor whether the company possesses the core operational strength to beat its lowered guidance and stabilize margin contraction. Rather than assuming a trend reversal based solely on short-term price drawdowns, market participants will focus on confirmed contract wins and margin recovery metrics.
Data collected as of (2026-11-07T04:02:17): Price 320.95USD · 1D -16.1% · 1W -24.97% · 1M -23.09% · 3M -46.18%
[Sources and Verification Timestamp]
Market Data: yahoo_chart_api · Verification Timestamp: 2026-11-07T04:02:17. Media Coverage Sources: Zacks, TIKR, Investing.com. Article headlines serve as factual reference points; primary sources such as corporate press releases and regulatory filings should be independently verified.
This content is provided for informational and analytical purposes only and does not constitute investment advice or a financial recommendation.
This content is for informational purposes only and is not investment advice.

