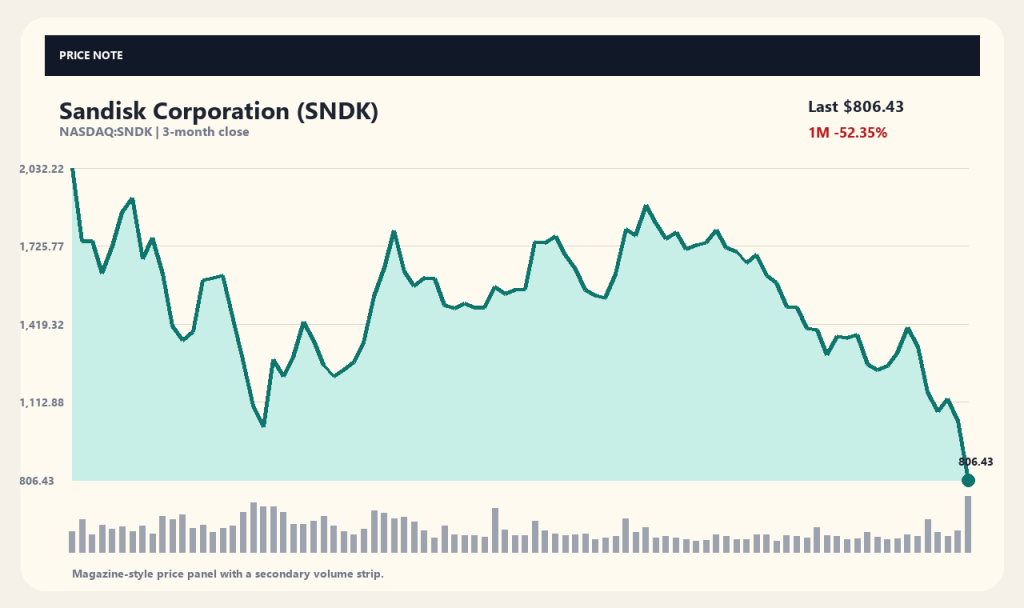
SanDisk Corporation (SNDK) stock plunged 22.26% in a single trading session during a recent major sell-off across US technology equities. The sharp decline drew heightened investor scrutiny as the Nasdaq Composite entered correction territory alongside steep pullbacks in major semiconductor and AI-related names, including Nvidia.
2. PARA: The steep drop reflects weakening broader tech market sentiment rather than company-specific negative catalysts. Semiconductor and memory chipmakers experienced joint pullbacks as the intense investment enthusiasm surrounding artificial intelligence and data centers showed signs of cooling off.
Extreme Price Volatility and Market Reaction
Paragraph 1
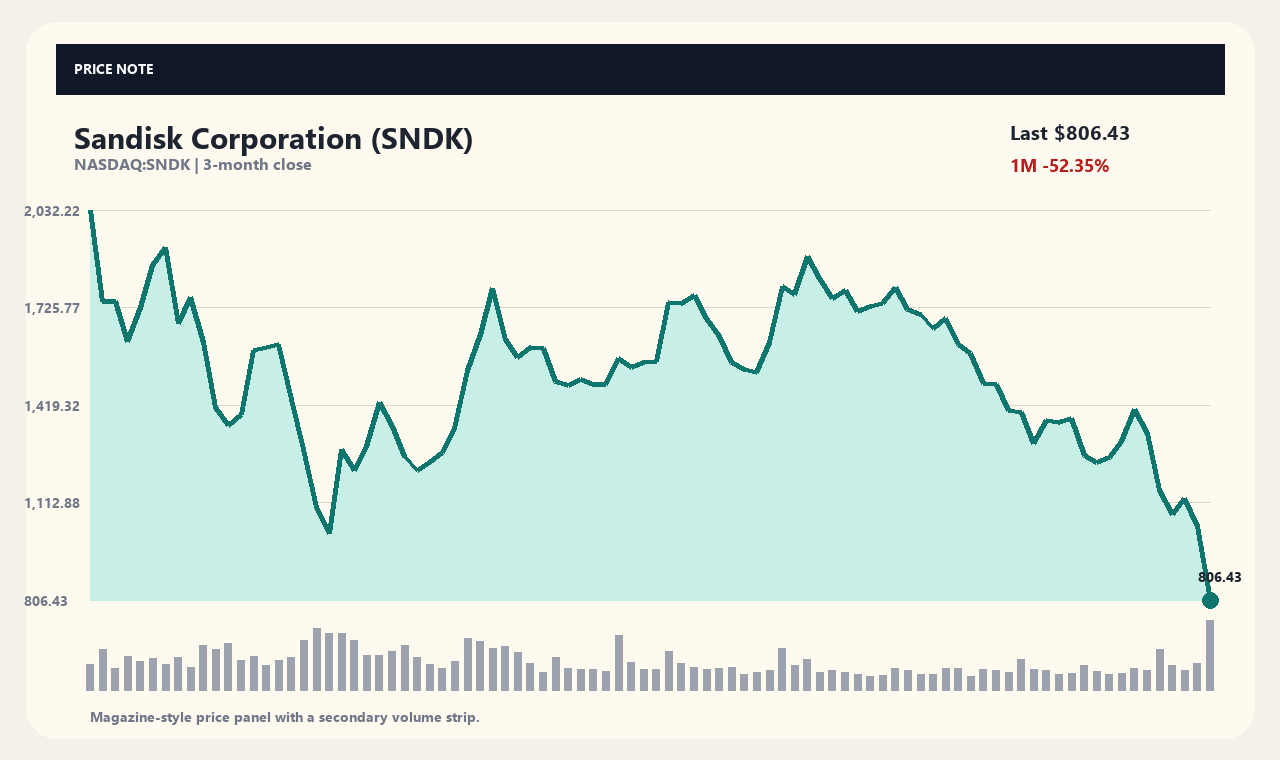
SanDisk shares dropped from a previous close of $1037.40 to $806.43, marking a single-day loss of over 22%. The stock experienced a steep short-term downward valuation, sliding 39.37% over a one-week period and 52.35% over one month.
Paragraph 2
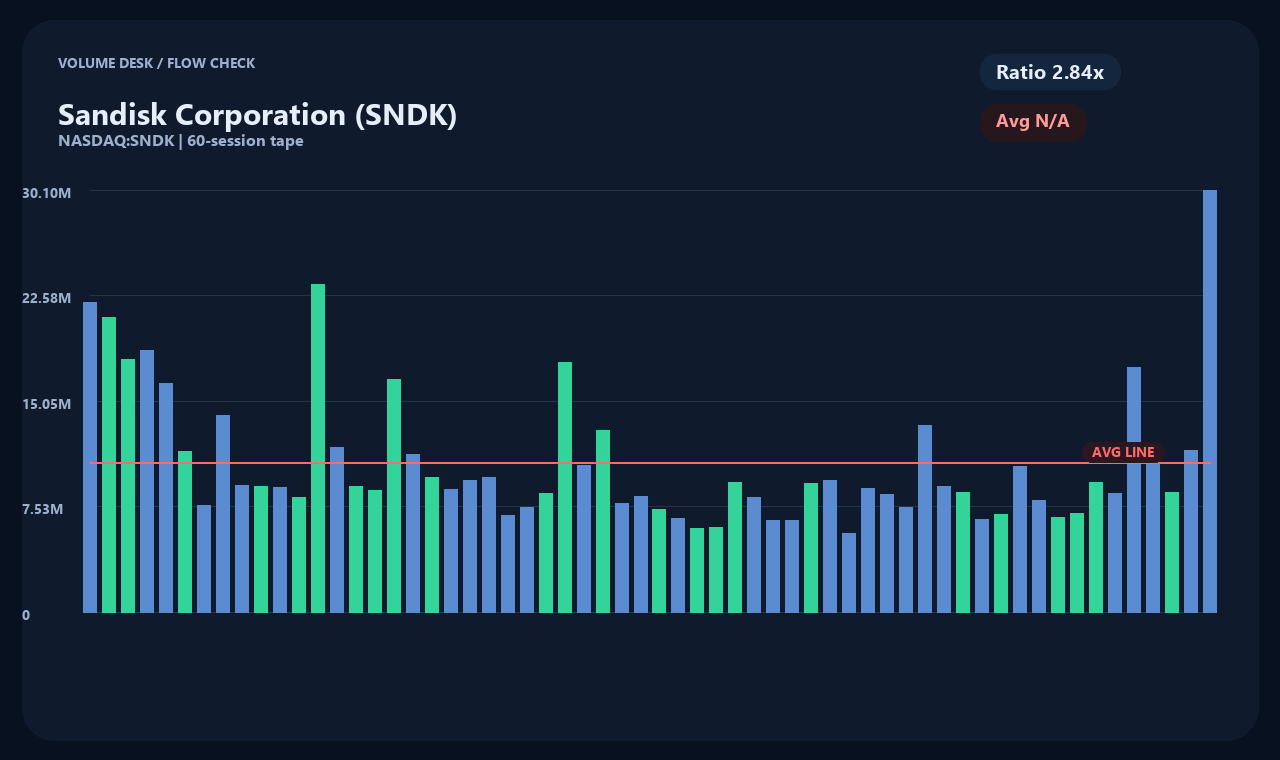
Trading activity surged alongside the sell-off, with volume climbing to 2.84 times its daily average. The heightened trading volume indicates heavy concentrated selling pressure during the decline.
NAND Flash Technology and Business Model Overview
Paragraph 1
SanDisk develops and manufactures data storage devices and solutions built on NAND flash technology. Its product portfolio spans high-performance solid-state drives (SSDs) for desktops and laptops, alongside embedded storage solutions for mobile devices, wearables, automotive applications, and IoT systems.
Paragraph 2
These products are distributed to global computer original equipment manufacturers (OEMs), enterprise customers, data centers, and cloud service providers. Although the company maintains strong cash flow and a healthy financial structure, its stock historically exhibits high volatility in response to shifts in downstream demand sentiment.
Broader Fallout from the AI Tech Sell-Off
Paragraph 1
Major financial outlets, including Investor's Business Daily and TheStreet, reported that the decline was directly tied to a broader sell-off across AI-related equities. As megacap tech leaders led by Nvidia pulled back significantly from their high-water marks, risk-off sentiment spread across the semiconductor and memory sectors.
Paragraph 2
Analysts highlighted the company's solid cash reserves and financial balance sheet stability, concluding that market-wide risk aversion dragged the share price lower regardless of individual corporate fundamentals. The pullback reflects heightened market sensitivity to minor concerns following stretched valuations across the tech sector.
Disconnect Between Financial Fundamentals and Market Valuation
Paragraph 1
Corporate summary data indicates SanDisk maintains robust revenues, strong net profit margins, and a low debt-to-equity ratio. While market observers view its strong cash-generation capability positively, shares continue to trade well below recent multi-month highs.
Paragraph 2
Trading at under 30% of its 52-week high of $2354.39, the gap between financial fundamentals and price action stems primarily from macroeconomic headwinds and shifting sector sentiment rather than operational underperformance.
Key Catalysts to Watch for Recovery
Paragraph 1
For the stock price to stabilize, AI and data center infrastructure spending must demonstrate sustained end-market demand. Investors will monitor whether broader tech volatility subsides and whether market focus returns to individual earnings results and cash generation capabilities.
Paragraph 2
Broader macroeconomic indicators, the interest rate environment, and incoming data on semiconductor industry trends will serve as critical benchmarks for future price trajectory. A disciplined approach focused on structural fundamentals is warranted over short-term price fluctuations.
Data collected at (2026-11-06T11:33:03): Price 806.43USD · 1D -22.26% · 1W -39.37% · 1M -52.35% · 3M -33.47%
[Sources and Verification Timestamp]
Market Data: yahoo_chart_api · Verification Timestamp: 2026-11-06T11:33:03. News References: Trefis, Yahoo Finance, Investor's Business Daily. Article titles serve as clues for factual verification; primary sources such as company disclosures should be verified independently.
This content is intended for informational and educational purposes only and does not constitute financial or investment advice.
This content is for informational purposes only and is not investment advice.

