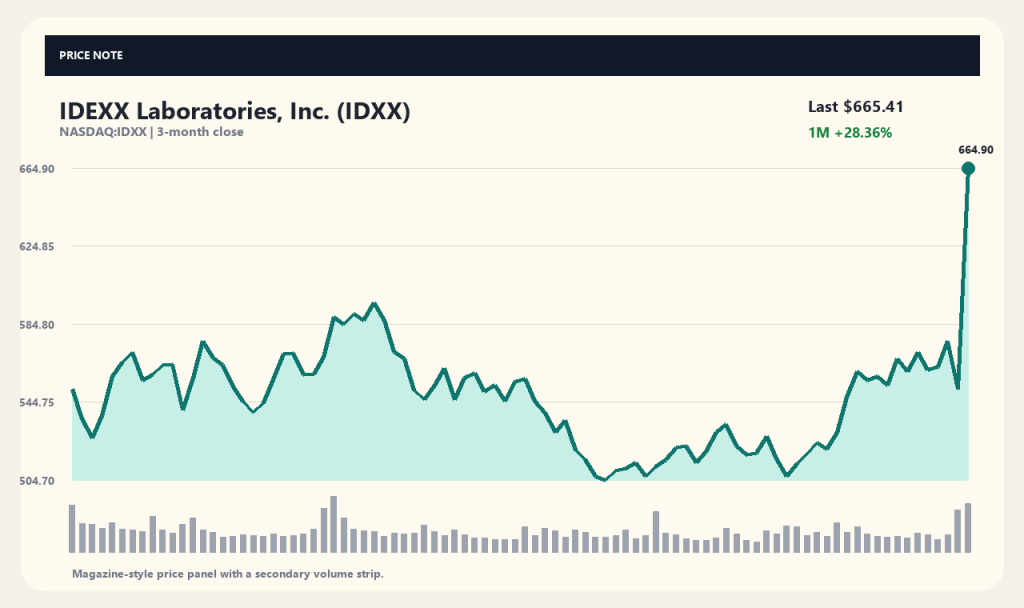
Shares of IDEXX Laboratories (IDXX) surged 20.72% in a single trading session following its Q3 earnings release, driven by better-than-expected results and an upgraded full-year outlook.
IDEXX provides veterinary diagnostics, practice software, and water testing products, making it critical to analyze whether this rally reflects underlying fundamental strength.
Q3 Earnings Beat Wall Street Estimates
IDEXX reported Q3 revenue of $1.21 billion and adjusted earnings per share (EPS) of $3.96, topping Wall Street consensus estimates of $1.19 billion in revenue and $3.73 EPS.
Revenue increased 10% year-over-year while EPS posted double-digit growth, powered by durable organic demand across its core Companion Animal Group (CAG) diagnostics and services unit.
Full-Year Guidance Raised on Product Innovation
Management raised full-year EPS guidance from a previous range to $14.96–$15.16, signaling strong execution and momentum entering the fourth quarter.
Management cited early-stage adoption of its broader innovation pipeline, with new product rollouts and global market expansion underpinning top-line acceleration.
Stock Price Breakout and Volume Surge
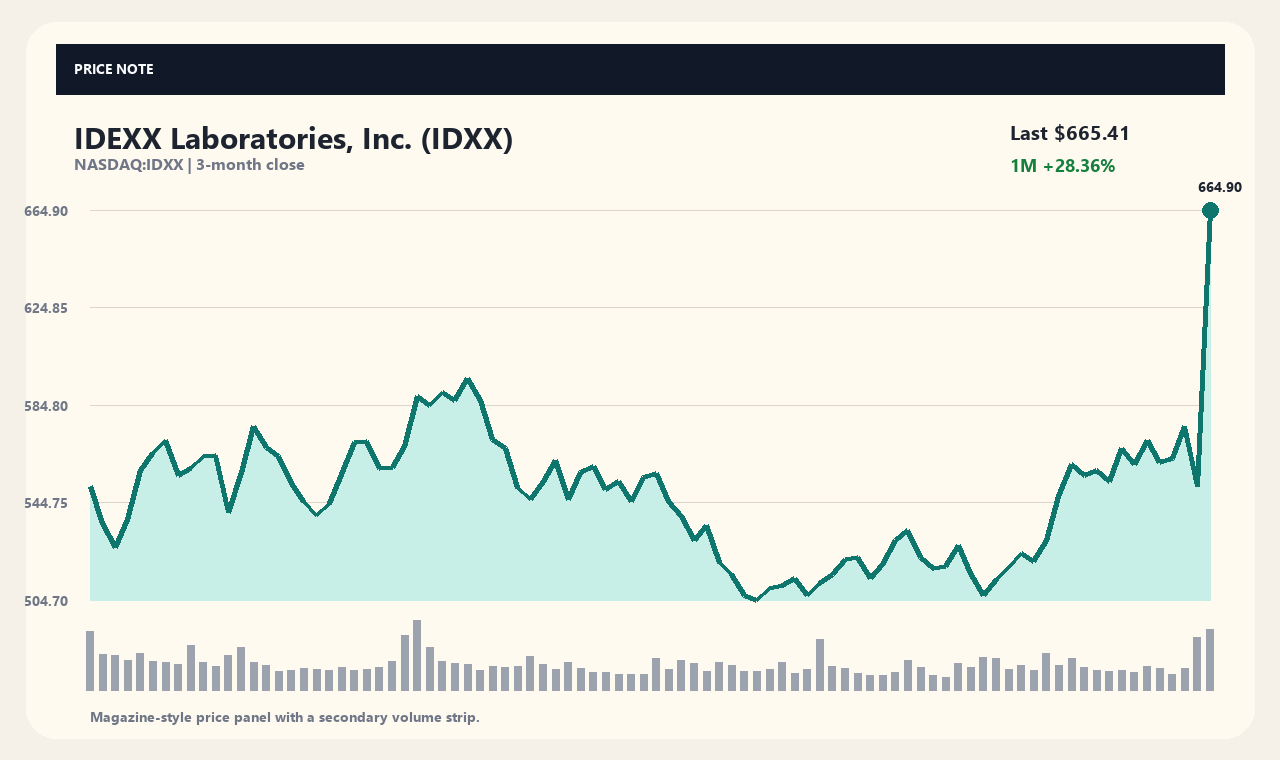
IDXX stock closed at $665.41 on earnings day, up 20.72% from the prior session close of $551.21, extending gains to 16.7% over the past week and 28.36% over the past month.
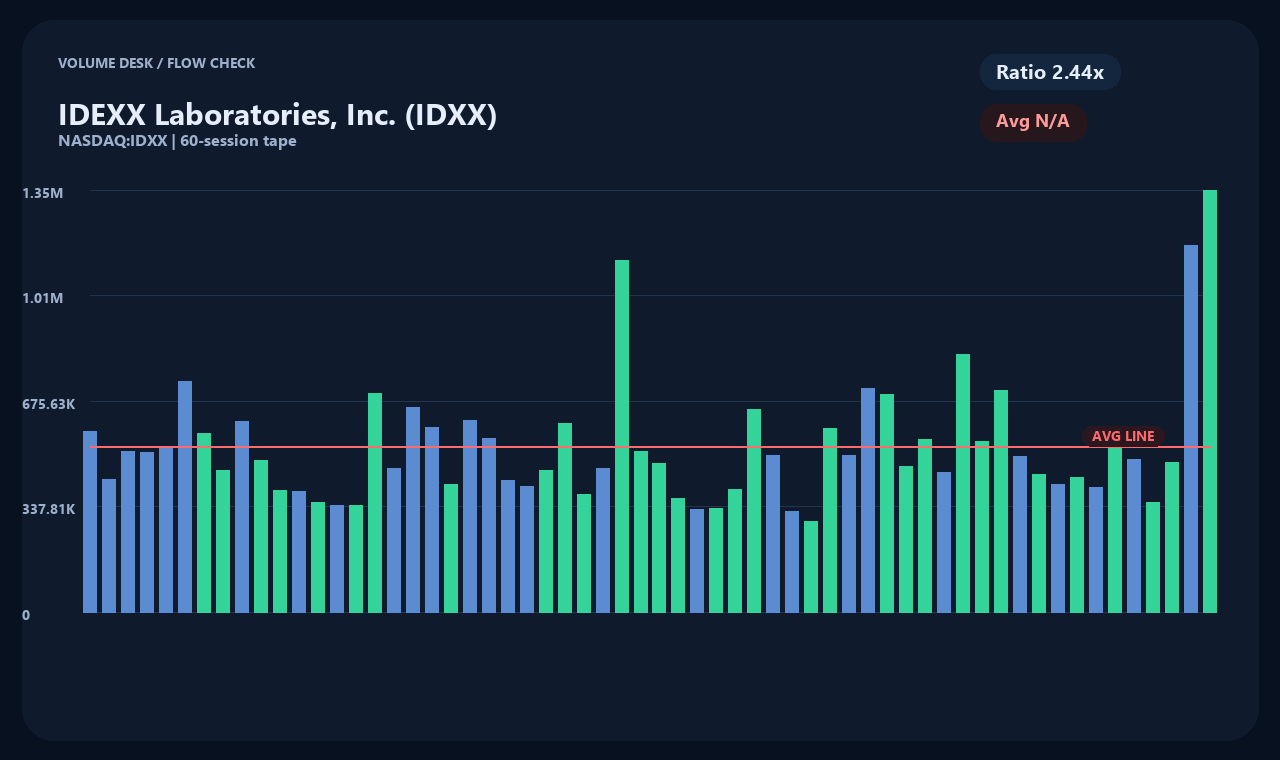
Daily trading volume expanded to more than twice its average level, though the sharp breakout creates a notable technical gap above key moving averages.
Outperforming Healthcare Sector Weakness
The stock's sharp rally diverged sharply from broader healthcare sector weakness, with publications like Barron's highlighting IDEXX's strong execution in a challenging macro backdrop.
While single-stock earnings momentum drove outperformance relative to lagging peers, investors must monitor whether this relative strength persists against broader sector headwinds.
Key Factors for Long-Term Valuation
Sustaining this valuation expansion depends on subsequent quarterly performance, specifically equipment capital expenditure recovery and recurring diagnostic consumables demand.
Short-term price spikes and elevated volume do not guarantee persistent long-term growth, making segment-level margin trends and revenue mix key metrics to watch.
Data as of (2026-11-03T04:03:44): Price 665.41 USD · 1D 20.72% · 1W 16.7% · 1M 28.36% · 3M 13.15%
[Sources and Verification Timestamp]
Market data: yahoo_chart_api · Timestamp: 2026-11-03T04:03:44. News sources: Barrons.com, MT Newswires. Article headlines serve as verification cues; cross-reference with official company SEC filings and announcements.
This content is for informational purposes only and does not constitute investment advice.
This content is for informational purposes only and is not investment advice.

