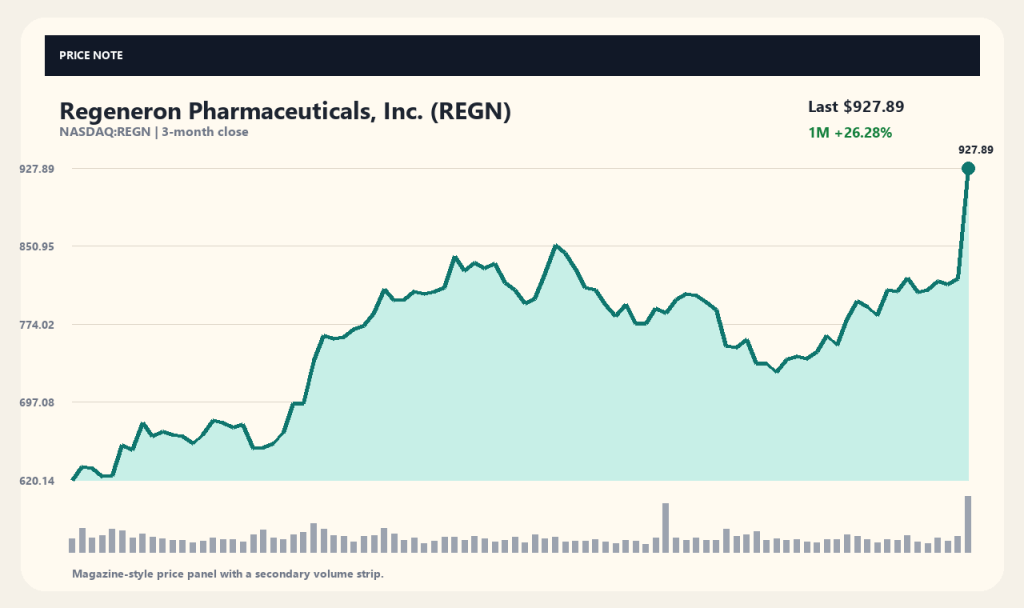
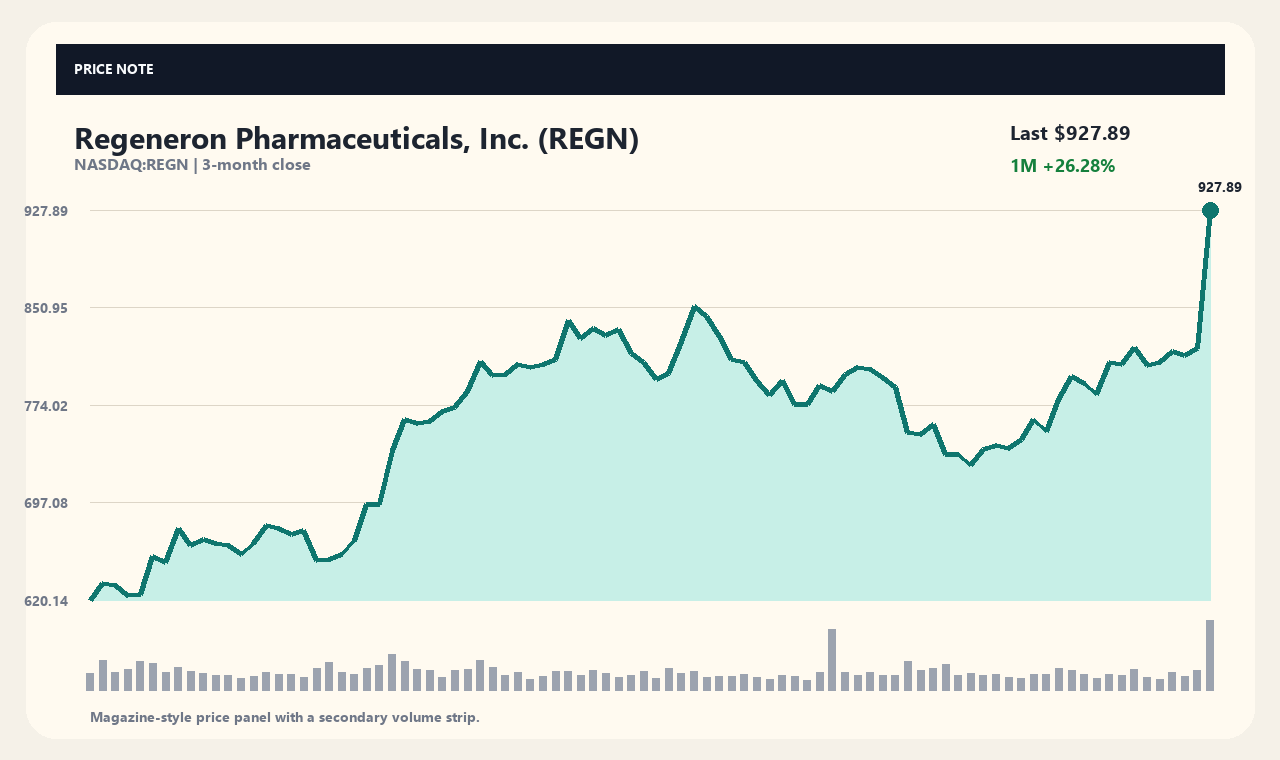
Shares of US biotech giant Regeneron Pharmaceuticals surged 13.33% in a single trading session to close at $927.89. The stock is now approaching its 52-week high of $935.35, marking a 15.26% gain over the past week and a 26.28% rise over the last month.
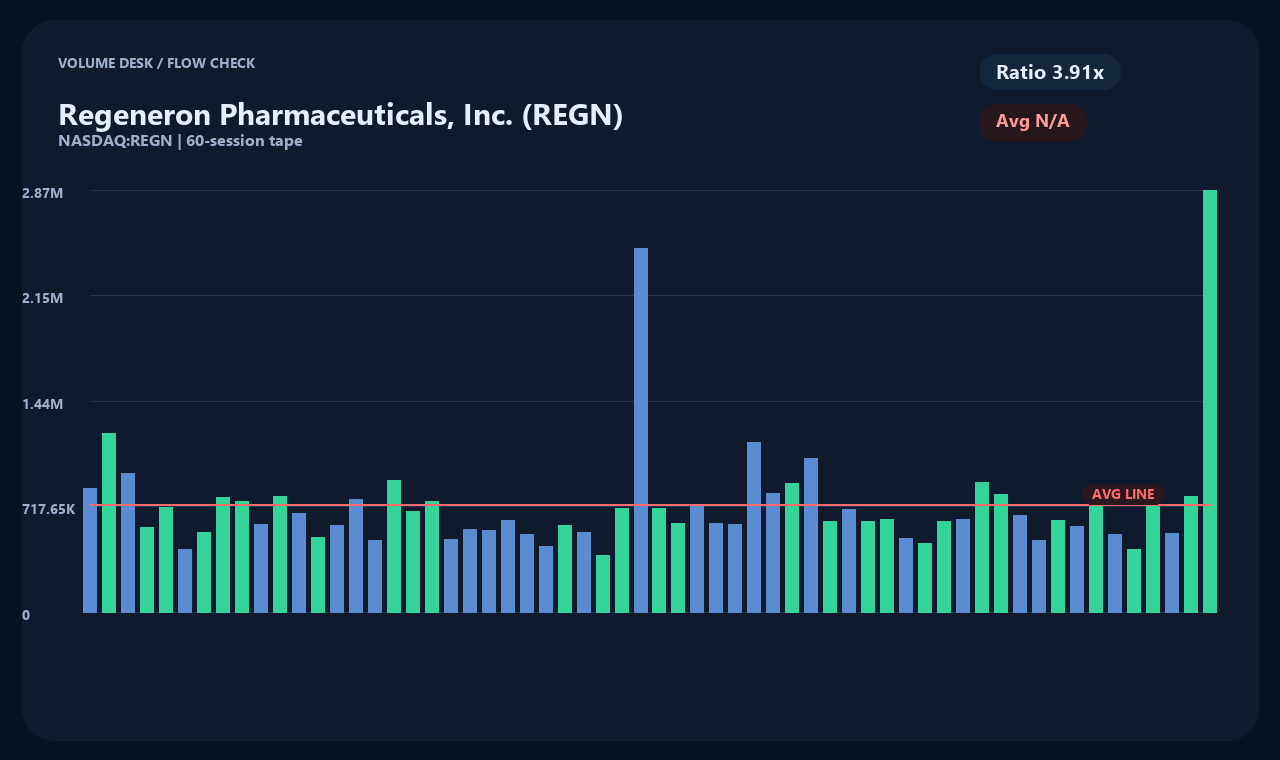
The sharp price movement was driven by Q3 financial results that surpassed Wall Street expectations, paired with robust sales of core therapies. Trading volume surged to more than three times its daily average, highlighting strong investor interest.
Q3 Financial Performance and Core Product Growth
Regeneron reported Q3 revenue of $5.12 billion, up 36% year-over-year. Non-GAAP earnings per share also topped market consensus, delivering a strong positive signal to Wall Street.
Key growth driver Dupixent generated $6.5 billion in global sales, representing a 35% increase, while US sales of Eylea HD jumped 62% to approximately $70 million. Libtayo also maintained its expansion trajectory with $5.5 million in revenue.
Rare Disease Clinical Data and Pipeline Progress
Beyond earnings, positive pipeline developments provided additional momentum. Regeneron reported encouraging extended clinical trial data for its rare disease candidate, showing zero instances of abnormal bone growth.
Market optimism was further boosted by the upcoming PDUFA priority review date for cemdisiran, a therapy co-developed with Alnylam Pharmaceuticals for myasthenia gravis. Advancements across these pipeline assets offer key long-term growth catalysts.
Technical Indicators: Price Action and Volume Analysis
From a technical perspective, REGN is trading significantly above key moving averages, currently hovering 17.62% above its 20-day MA and 16.6% above its 60-day MA.
Trading volume surged to 2.87 million shares, vastly exceeding its average daily volume of 730,000 shares. The swift upside expansion suggests entering a phase of elevated price volatility.
Balance Sheet Strength and Cash Flow Profile
On the fundamental front, Regeneron reported total revenue of $16.90 billion and net income of $4.82 billion. Operating cash flow reached $4.85 billion, with free cash flow standing at $2.58 billion.
Solid cash generation continues to provide robust backing for aggressive R&D spending and pipeline expansion, while cash reserves remain exceptionally healthy relative to debt obligations.
Catalysts and Risk Factors to Watch
Whether the current rally sustains will depend on regulatory approval milestones for key pipeline assets and ongoing top-line expansion for core products. Upcoming FDA target action dates and late-stage trial readouts remain critical variables.
Investors should also monitor potential consolidation following the sharp short-term rally, alongside broader sentiment shifts across the biotechnology sector.
Market snapshot (as of 2026-11-02T04:04:07): Price $927.89 USD · 1-Day +13.33% · 1-Week +15.26% · 1-Month +26.28% · 3-Month +22.21%.
Data Sources and Verification Timestamp
Market data: yahoo_chart_api · Timestamp: 2026-11-02T04:04:07. Related coverage source: additional verification required. Article titles serve as factual leads; primary sources such as corporate filings and press releases should be independently verified.
This content is provided for informational purposes only and does not constitute investment advice.
This content is for informational purposes only and is not investment advice.

