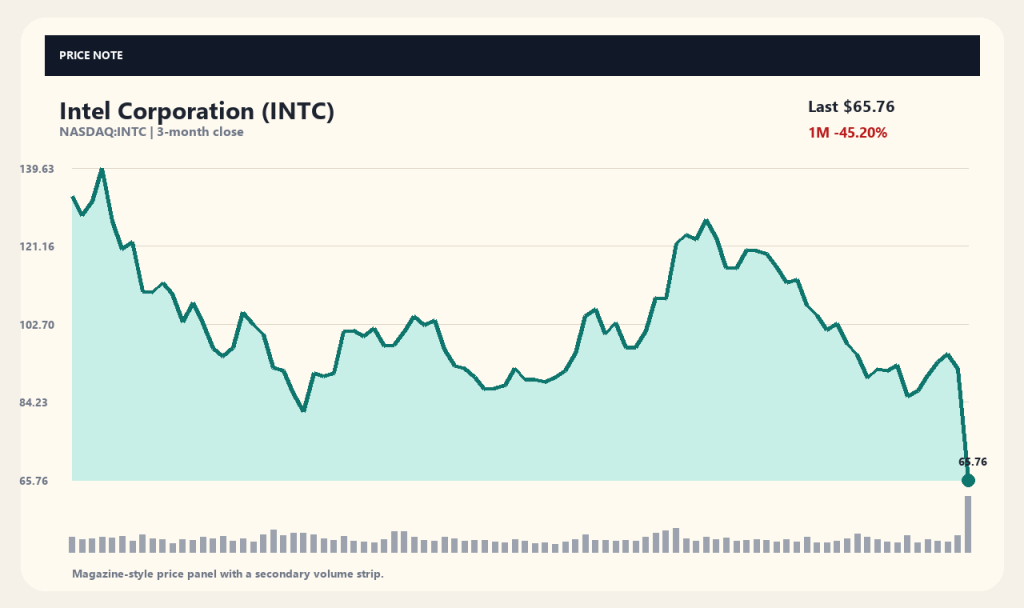
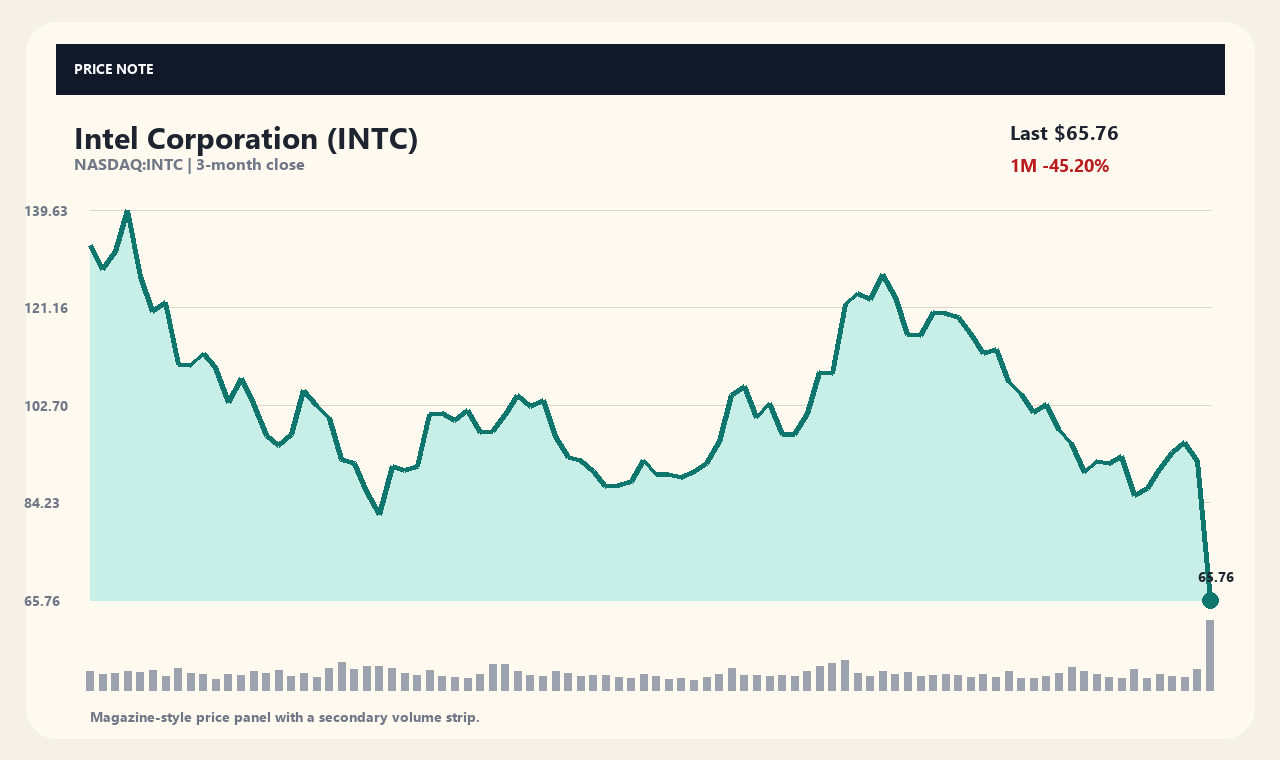
Intel Corporation (INTC) stock tumbled 28.58% from its previous close to hit $65.76 in a sharp single-day move. The steep drop pushed the shares 31.78% below their 20-day moving average ($96.39) and 34.73% beneath their 60-day moving average ($100.76).
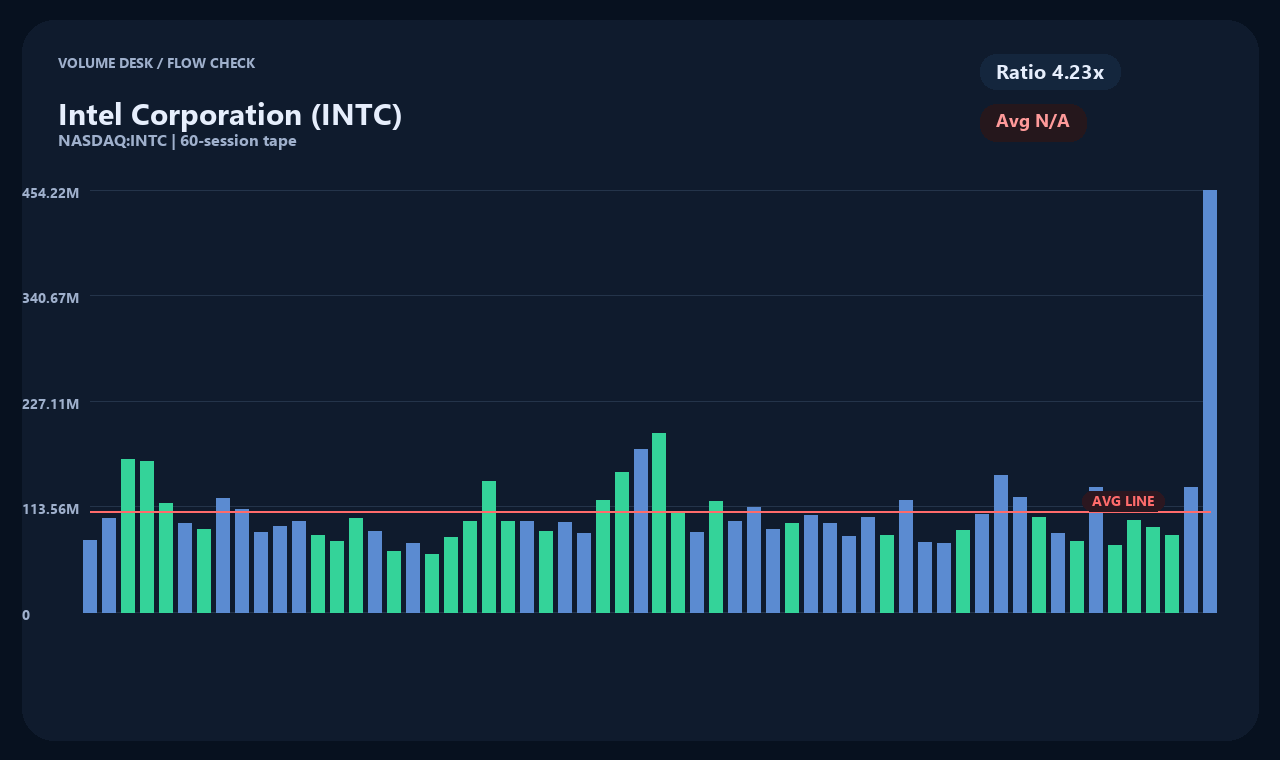
2. PARA: Following this decline, Intel's 1-month return stands at -45.2% and its 3-month performance reaches -27.74%. Trading volume surged to an unusual 455.59 million shares—4.23 times its daily average of 176.54 million shares—highlighting extreme market concentration.
Numerical Breakdown of the Volatility and Volume Surge
Intel closed at $65.76, down $26.31 from the previous session's close of $92.07. Relative to its 52-week range of $32.89 to $142.35, the stock currently trades at roughly the 30.03% percentile level.
The quadrupling of average volume reflects intense trading turnover among investors. However, heightened volume alone signals heightened market disagreement over valuation rather than an exclusive dominance by sellers or buyers.
Financial Metrics and Fundamentals Overview
According to Yahoo Finance summary data, Intel generated total revenue of $59.89 billion alongside net income attributable to parent shareholders of -$12.03 billion. Diluted earnings per share (EPS) stand at -$2.42, yielding a net profit margin of -20.09%.
On the balance sheet, cash holdings total $54.00 billion against total debt of $50.13 billion. Operating cash flow reached $17.47 billion, while free cash flow stood at $670.37 million.
Tech Sector Environment and Media Coverage
Major financial media recently highlighted shifting sentiment across technology and AI stocks. Bloomberg reported Wall Street preparing for extended volatility after a broader tech slide, while The Wall Street Journal noted rising investor concern over capital expenditures among AI-focused firms.
Meanwhile, Investor's Business Daily and Yahoo Finance identified equity sell-offs, Big Tech earnings, and midterm election impacts as primary market drivers. These reports indicate that broader tech sector headwinds contributed to the pressure alongside any company-specific factors.
Constraints on Single Catalyst Verification
Based on available news reports and official filings, no single definitive catalyst has been established to explain Intel's entire 28.58% single-day collapse. With media coverage focusing broadly on tech pullbacks and AI sentiment, isolating a single cause remains unverified.
Investors should exercise caution before assuming direct causality beyond the verified metrics. Until official corporate announcements or explicit earnings details are released, avoiding speculative assumptions remains advisable.
Key Catalysts and Factors to Watch Moving Forward
Assessing Intel's future price trajectory requires tracking top-line revenue and net income recovery in upcoming quarterly results. Stabilizing the current net loss position and driving an EPS rebound represent central performance metrics.
Additionally, monitoring whether operating cash flow remains stable relative to its $50 billion debt load, alongside potential trend reversals across broader technology sentiment, will serve as primary indicators.
Data as of timestamp (2026-11-02T04:04:08): Price $65.76 USD · 1D -28.58% · 1W -24.38% · 1M -45.2% · 3M -27.74%
Sources and Verification Timestamp
Market data: yahoo_chart_api · Verification time: 2026-11-02T04:04:08. Media reference source: Investor's Business Daily. Headlines serve as verification leads; primary corporate disclosures and SEC filings should be reviewed for confirmation.
This content is provided for informational and educational purposes only and does not constitute investment advice or a recommendation to buy or sell securities.
This content is for informational purposes only and is not investment advice.

