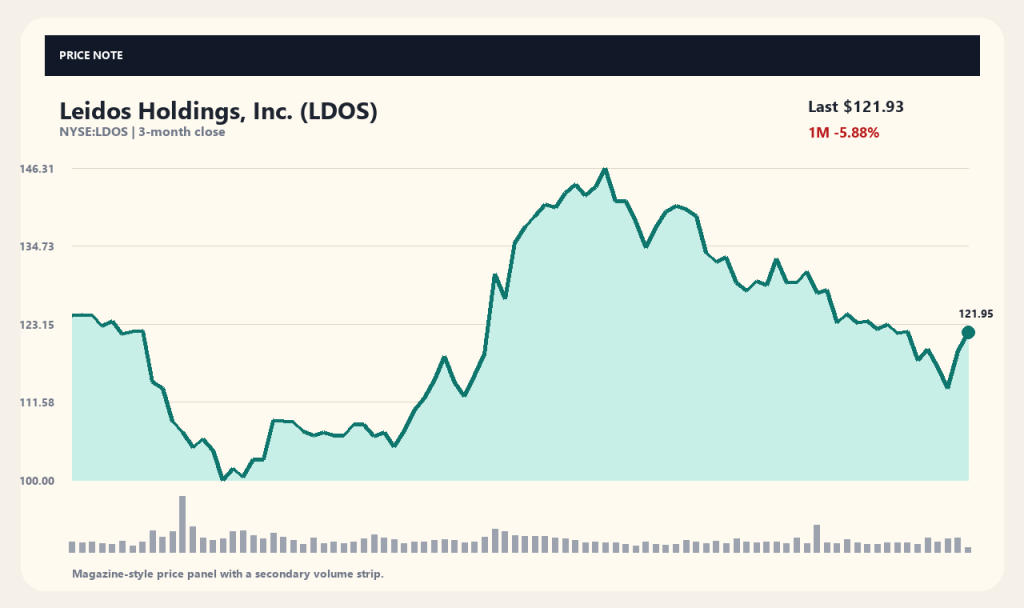
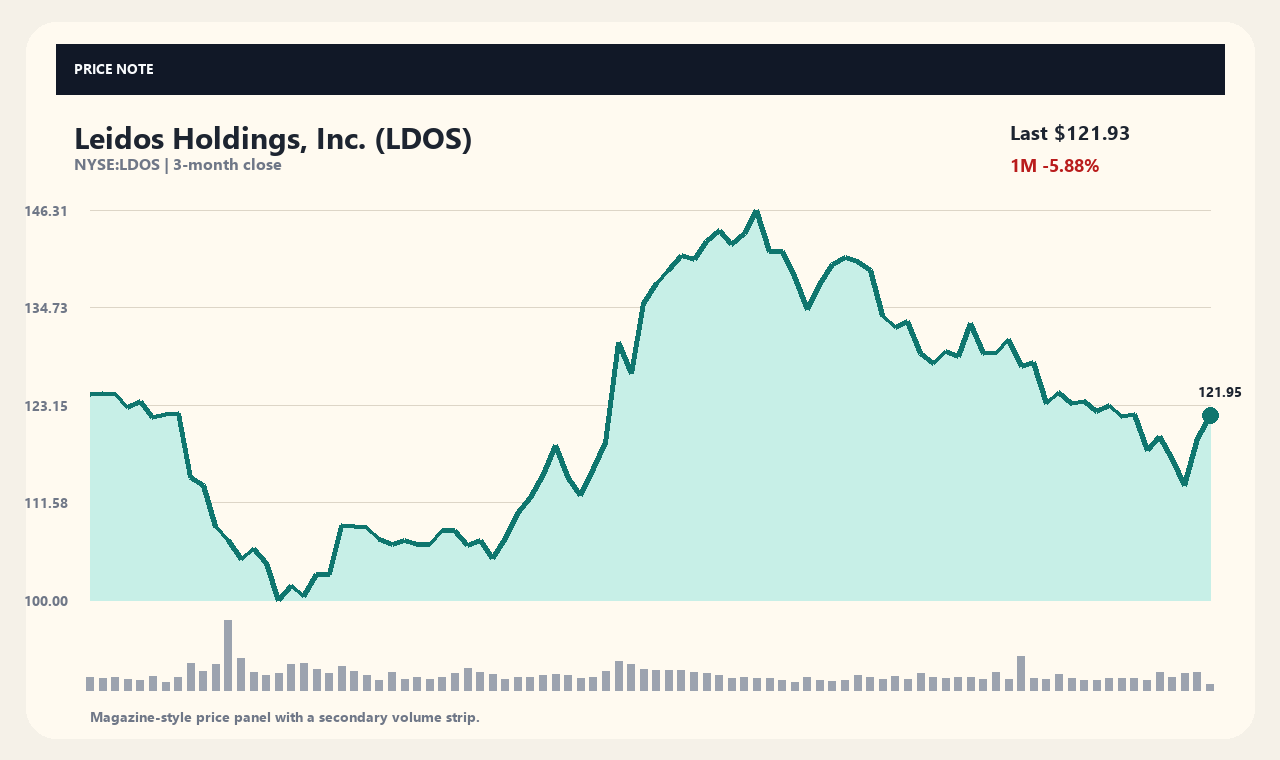
Shares of government and defense IT services provider Leidos Holdings (LDOS) rose 2.27% to $121.93 as of October 10, 2026. The stock is up 3.56% over the past week and 14.40% over three months, though it has consolidated with a 5.88% pullback over the last month. Investors are currently weighing this price rebound against a wave of price target downgrades from major investment banks.
Leidos Holdings operates as a major government contractor providing IT and engineering solutions across defense, intelligence, civil, and health sectors. Recent broker actions include a downgrade from JPMorgan alongside price target reductions from Citigroup and BNP Paribas. The market is digesting mixed catalysts, balancing fears over decelerating growth against fresh contract awards.
Investment Banks Cut Leidos Price Targets
According to reports from MT Newswires and other outlets, JPMorgan downgraded Leidos Holdings from Overweight to Neutral and lowered its price target from $160 to $142. Citigroup reduced its price target from $161 to $141, while BNP Paribas trimmed its target from $175 to $150. These cuts reflect a more cautious outlook on the company's near-term revenue expansion.
The revised analyst ratings stem from expectations that contract award growth and top-line momentum could face near-term ceilings. Despite reducing its target, BNP Paribas maintained its Outperform rating. These valuation adjustments signal a shift in institutional sentiment that could exert downward pressure on market sentiment.
Department of War Contract Award and Core Fundamentals
Leidos Holdings recently secured an IDIQ contract valued at up to $85 million from the U.S. Department of War for aerospace systems design research. The program focuses on mission-oriented integrated engineering, reinforcing the company's competitive edge in defense IT. Securing federal agreements helps solidify its long-term revenue backlog.
The company generates revenue across key verticals, including national security, digital modernization, health, civil services, and defense systems. Given the contract-driven nature of government IT services, federal budget allocations and award cadence drive corporate performance. The new contract wins serve as a positive catalyst to help offset downgraded Wall Street forecasts.
Volume Trends and Technical Indicator Analysis
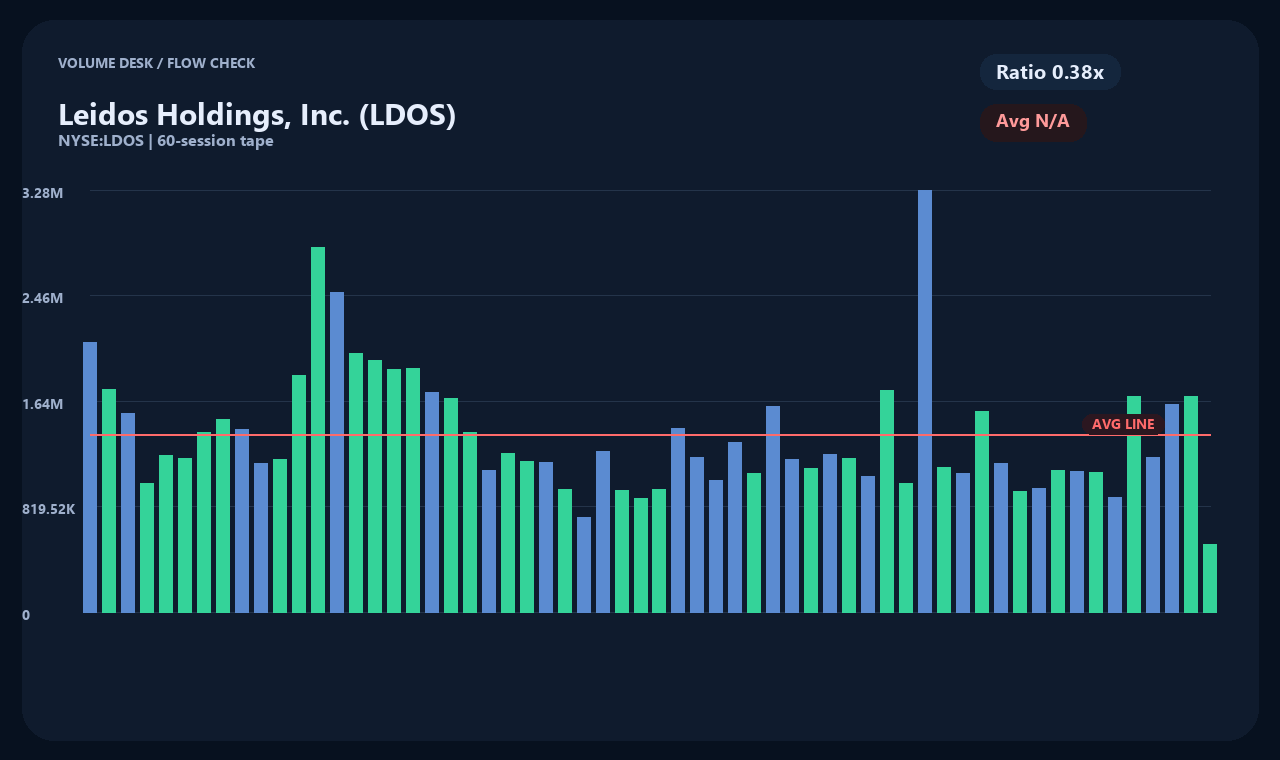
Trading volume stood at 521,392 shares, reaching roughly 0.38x its average volume of 1,377,409 shares. Moving higher on light volume suggests a technical bounce due to limited selling pressure rather than robust institutional buying. Low-volume gains indicate that market participants remain largely in a wait-and-see stance.
Within its 52-week trading range of $98.86 to $205.77, the stock sits at the 21.58% percentile level. Leidos continues to trade below key moving averages, sitting -1.31% under its 20-day moving average ($123.55) and -4.38% below its 60-day moving average ($127.51). Trading beneath short- and medium-term moving averages highlights the need for further directional confirmation.
Financial Metrics and Profitability Overview
Financial data shows Leidos Holdings generating approximately $17.634 billion in annual total revenue and $1.376 billion in net income. The stock trades at a trailing P/E ratio of 11.38x with earnings per share (EPS) of $10.71. Net profit margin stands at 7.80%, demonstrating steady earnings generation.
Balance sheet data indicates $748 million in cash reserves against total debt of $6.578 billion. Annual operating cash flow reached $2.3 billion, with free cash flow of roughly $1.146 billion. Robust cash generation provides a solid financial cushion even if profit growth moderates, though debt levels and interest expenses remain key metrics to monitor.
Key Catalysts and Investment Outlook
The main driver for Leidos Holdings' trajectory will be its ability to consistently secure major government contract awards. Investors will be monitoring upcoming quarterly earnings to see if revenue growth (recently 7.2%) and net income growth (recently -6.7%) rebound. Federal defense spending priorities and policy shifts will also dictate earnings volatility.
Additional wall street rating adjustments and price target changes will be crucial to follow. Reclaiming the 20-day and 60-day moving averages alongside a return to average trading volume could mark a short-term trend reversal. A comprehensive strategy requires assessing actual revenue conversion timelines and financial health indicators.
Market Snapshot (2026-10-10T04:02:17): Price $121.93 | 1D: 2.27% | 1W: 3.56% | 1M: -5.88% | 3M: 14.4%
[Data Sources and Verification Time]
Market data: yahoo_chart_api · Timestamp: 2026-10-10T04:02:17. Media coverage: MT Newswires. Headline details serve as verification leads; investors should confirm primary company disclosures and regulatory filings.
This article is strictly for informational purposes and does not constitute investment advice.
This content is for informational purposes only and is not investment advice.

