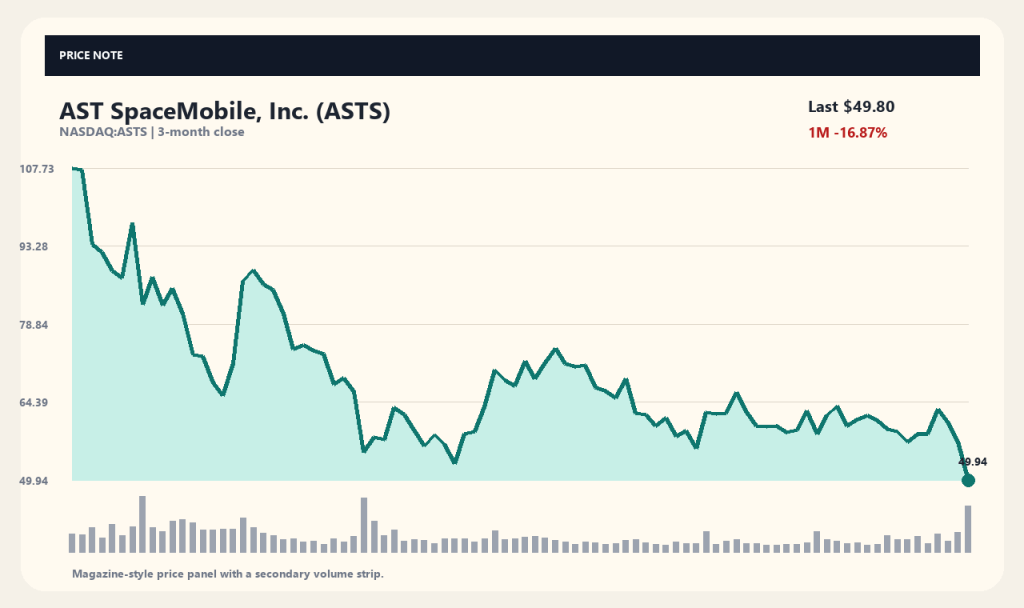
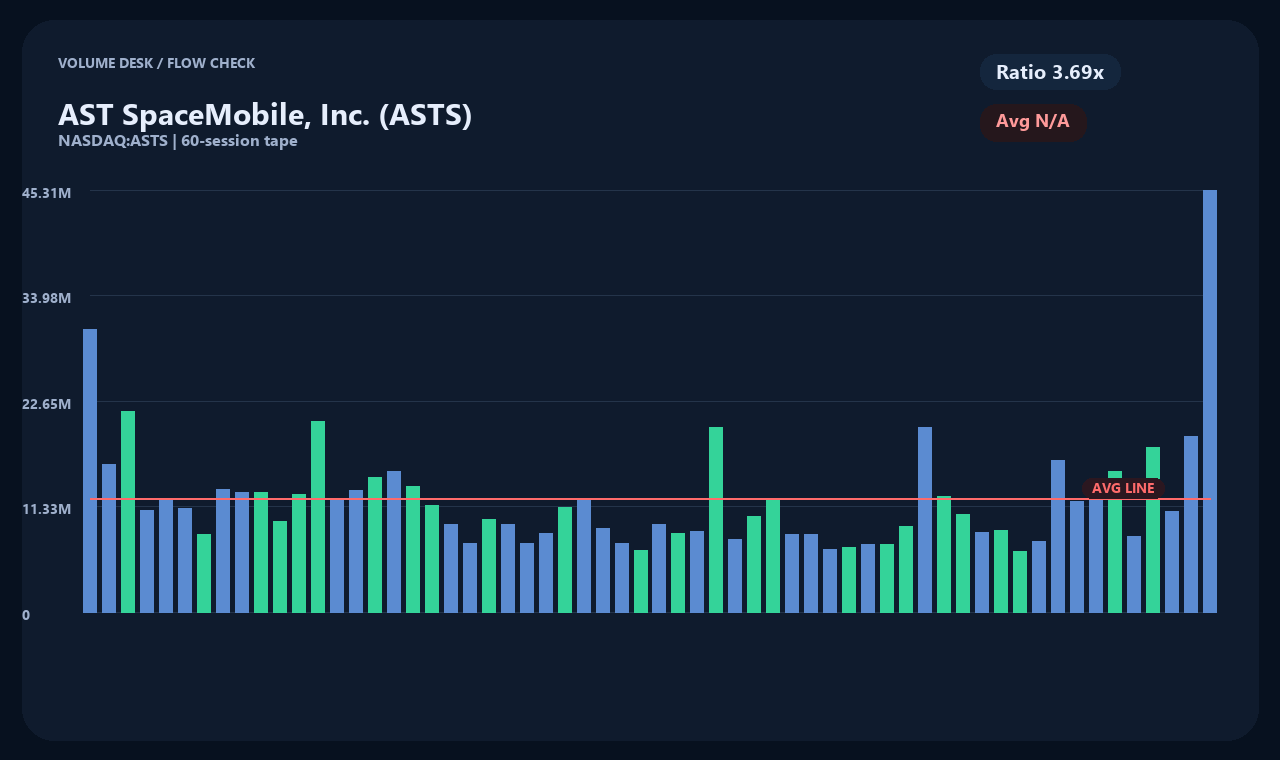
AST SpaceMobile (NASDAQ: ASTS) stock fell 12.52% to close at $49.80 in the previous trading session. Trading volume surged to approximately 45.17 million shares, well over three times its average daily volume of 12.24 million shares. The sharp decline came as reports surfaced that rival SpaceX signed a major spectrum acquisition deal, sparking investor concern over AST SpaceMobile's competitive positioning in the space-based cellular market.
SpaceX's spectrum acquisition creates immediate competitive hurdles for AST SpaceMobile, challenging the relative exclusivity it enjoyed in the direct-to-cell satellite sector. Media reports indicate that SpaceX acquired wireless spectrum to boost its Starlink network, triggering a wave of volatility across space and telecom equities. For investors, the central question is how SpaceX's newly acquired spectrum will affect AST SpaceMobile's core business model and carrier partnership structure.
SpaceX Spectrum Deal Triggers Market Sell-Off
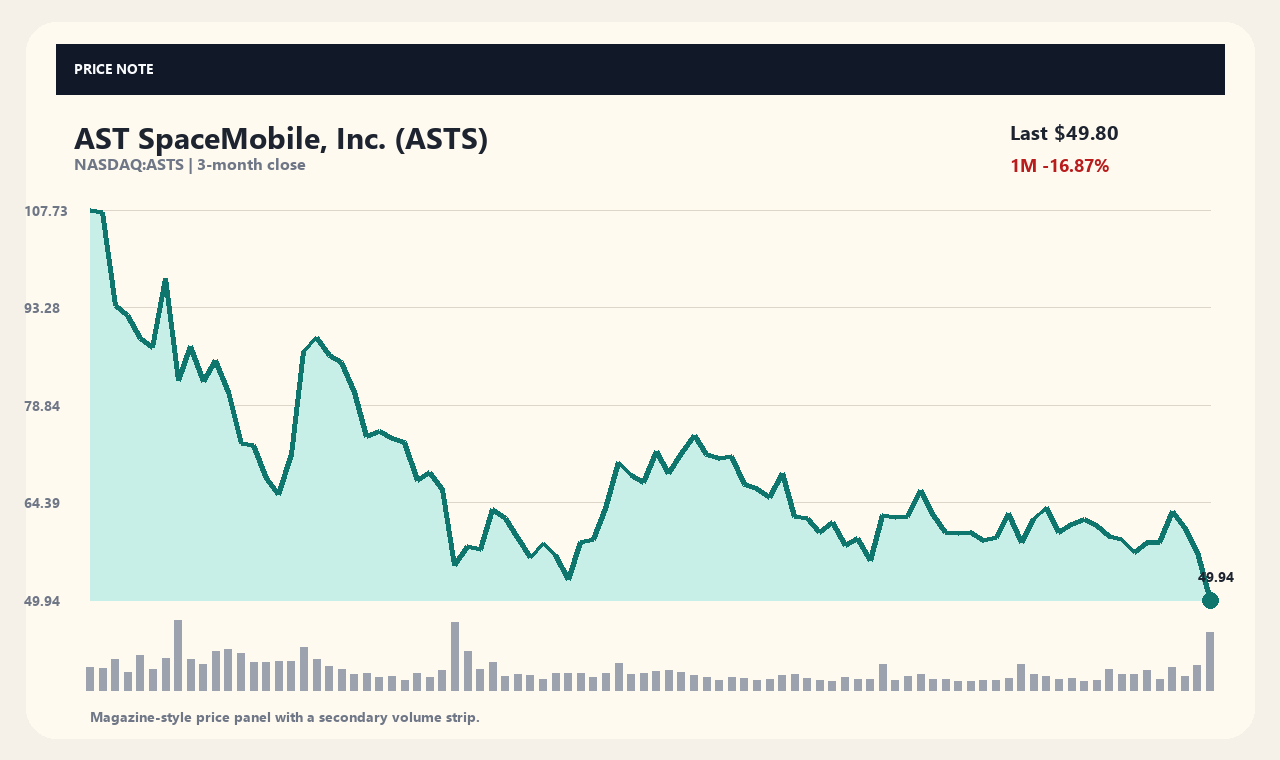
According to reports from outlets including 24/7 Wall St., SpaceX is pursuing or has completed an estimated $8 billion spectrum acquisition. News of the deal initially sent AST SpaceMobile shares down more than 6% before losses widened to 12.52% by the close. The selling pressure across space communications stocks accelerated on analyst commentary suggesting SpaceX could lock up key low-band spectrum options or significantly strengthen its proprietary network infrastructure.
On the other hand, analysts at firms like Roth Capital noted that the massive dollar figure attached to SpaceX's transaction could re-rate the intrinsic value of low-band spectrum assets across the sector. A capital commitment of this scale by a major competitor highlights the vast total addressable market for direct-to-smartphone satellite communications. However, broad market sentiment focused primarily on the risk of heightened direct competition rather than long-term asset revaluation.
Spectrum Strategy and Direct-to-Cell Network Impact
AST SpaceMobile is developing its BlueBird satellite constellation, designed to function as a space-based cellular broadband network delivering direct connectivity to unmodified smartphones. Providing cellular service in coverage dead zones without specialized hardware is the company's core value proposition. Consequently, securing dedicated spectrum rights or executing spectrum-sharing agreements with wireless carriers represents a critical operational dependency.
Chief Executive Officer Abel Avellan has previously highlighted that U.S. wireless carriers hold roughly 1,000 MHz of low- and mid-band spectrum that can be leveraged for the company's service. While SpaceX chose to purchase spectrum assets outright, AST SpaceMobile relies on a strategic partnership model to access existing carrier frequencies. How these diverging approaches impact deployment speed and long-term cost structures remains a key operational metric to monitor.
Recent Price Action and Technical Levels
AST SpaceMobile reached a 52-week high of $133.86, but its recent pullback to $49.80 places the stock in the lower 2.59% of its 52-week price range. The equity has experienced sustained downward momentum, falling 14.79% over the past week, 16.87% over the past month, and 26.30% over the past three months. Relative to key trendlines, the stock trades 16.39% below its 20-day moving average ($59.57) and 19.74% below its 60-day moving average ($62.06).
These technical metrics reflect historical price performance and do not predict future stock direction or institutional intent. Similarly, the volume spike to 3.69 times normal levels highlights intense market debate and diverging views rather than clear buyer or seller dominance. A deep drop from all-time highs does not automatically signify a valuation discount or an imminent bounce, as broader market uncertainties persist.
Balance Sheet Dynamics and Free Cash Flow Constraints
Financial data retrieved in October 2026 shows AST SpaceMobile reported quarterly total revenue of approximately $115.29 million against a net loss of $618.76 million. The balance sheet reflects total cash holdings of roughly $2.29 billion compared to total debt of $2.99 billion. Free cash flow stood at negative $1.80 billion, highlighting significant capital expenditures during the satellite network rollout phase.
Building out a commercial satellite constellation requires ongoing capital outlays for technology development and orbital launches. While heavy net losses and negative cash burn are common during early-stage infrastructure builds, the company's debt burden and capital consumption rate remain key risk factors. A primary financial milestone will be executing planned satellite launch schedules without operational delays while competing against well-capitalized players like SpaceX.
Catalysts and Key Monitorables for Investors
Future shifts in market sentiment will largely depend on confirmed launch timelines for commercial BlueBird satellites and tangible progress on carrier commercialization agreements. Investor focus remains on carrier reactions following SpaceX's spectrum move and whether major mobile network operators remain committed to AST SpaceMobile. Continued spectrum cooperation or direct capital contributions from key partners would help offset near-term competition concerns.
Conversely, if SpaceX achieves commercial service rollout faster than anticipated or if AST SpaceMobile faces further satellite launch delays, the timeline for revenue ramp and path to profitability could be pushed back. Furthermore, because key valuation metrics such as price-to-earnings (P/E) ratios and forward EPS estimates are unavailable in the current dataset, determining exact valuation multiples remains difficult. Investors should monitor upcoming earnings releases and official corporate updates for clear timelines on cash flow generation.
Data collection snapshot (2026-10-10T04:02:18): Price $49.80 USD · 1-Day -12.52% · 1-Week -14.79% · 1-Month -16.87% · 3-Month -26.30%
[Sources and Timestamp]
Market data: yahoo_chart_api · Timestamp: 2026-10-10T04:02:18. Related reporting source: 24/7 Wall St.. Article titles serve as fact-checking reference points; cross-reference with official company SEC filings and announcements.
This content is provided solely for informational and educational purposes and does not constitute investment advice or a financial recommendation.
This content is for informational purposes only and is not investment advice.

