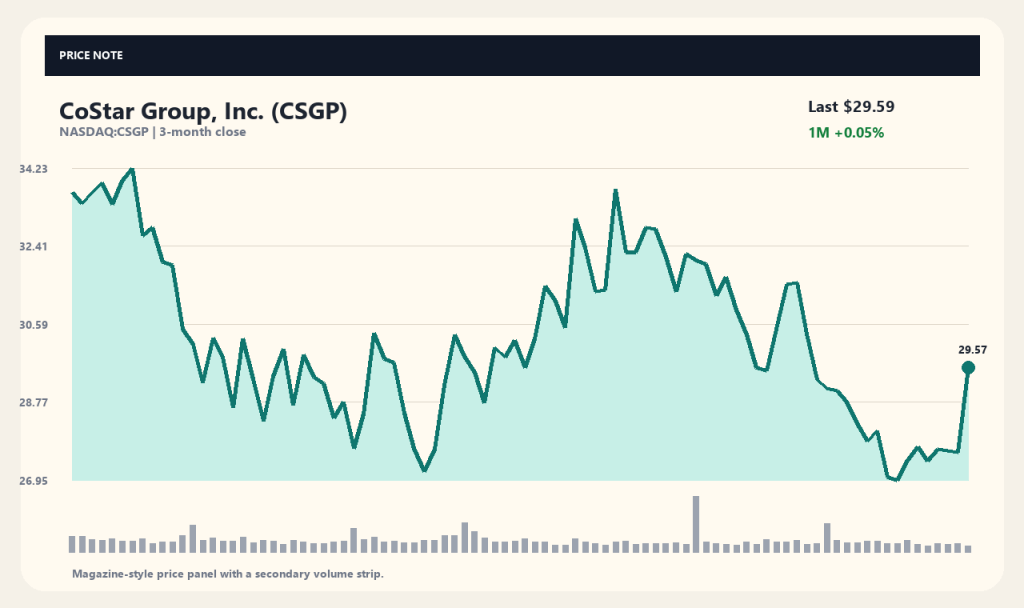
Commercial real estate data provider CoStar Group (NASDAQ: CSGP) bounced over 7% in a single session to close at $29.59. With the stock recently falling from its 52-week high of $79.21 down toward the $25.89 level, market participants are debating whether this surge is a short-term technical bounce or a fundamental shift driven by improving earnings expectations. Investors remain heavily focused on how aggressive capital deployment into its flagship Homes.com platform will impact overall corporate profitability.
The company operates a global business model supplying commercial and residential real estate information platforms alongside data analytics services. While recent media coverage noted asset managers such as Baillie Gifford highlighting upside potential, critics contend that elevated marketing and investment spend on Homes.com is masking the strength of CoStar's core business. Ahead of its Q3 earnings release scheduled for October 27, the primary catalyst for investors will be assessing how these cost pressures are squeezing operating margins.
Profitability Debate Surrounding Major Platform Investments
CoStar Group generates transaction fee and subscription data revenue across a portfolio of real estate information platforms, including CoStar Property, LoopNet, Homes.com, and ApartmentFinder.com. While total revenue has reached approximately $3.556 billion following several quarters of steady top-line expansion, net income stands at roughly $74 million. This translates to a slim net profit margin of approximately 2.08%, underscoring profitability expansion as a central challenge.
Financial media outlets like Insider Monkey have analyzed whether massive capital allocation toward Homes.com is eroding CoStar's legacy profit engine or simply masking underlying enterprise value. Aggressive marketing outlays to penetrate the residential real estate market have likely served as a drag on short-term net earnings. Despite the stock's recent pop, market participants are scrutinizing the payoff velocity and return on investment relative to expenditure across its primary platforms.
Balance Sheet Structure and Cash Flow Durability
Examining CoStar Group's financial position, total cash and equivalents stand at approximately $1.266 billion against total debt of roughly $1.155 billion. The balance sheet maintains solid liquidity, supported by operating cash flow of approximately $497 million and free cash flow of $412.7 million. This provides the company sufficient organic capital to fund strategic initiatives and platform expansion without relying on external financing.
However, the stock commands a rich valuation with a price-to-earnings (P/E) multiple of approximately 164.28x, leaving equity prices vulnerable to elevated volatility if profit growth falls short of consensus expectations. Although top-line growth remains intact with revenue expanding 18.4%, net income must accelerate to justify this premium multiple. Ultimately, investors are closely watching for the inflection point where robust cash flow and growth investments translate into tangible bottom-line profits.
Technical Price Action and Volume Analysis
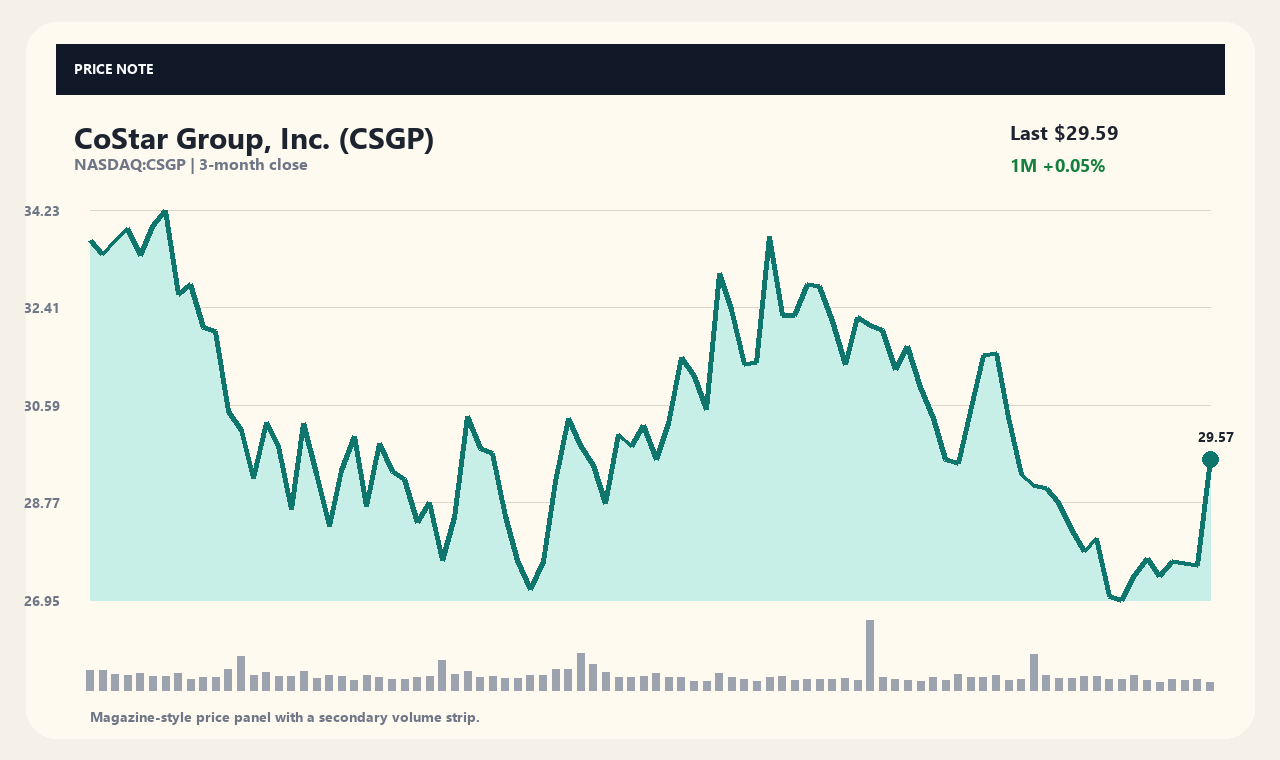
At the time of data collection, CoStar Group traded at $29.59, up 7.23% for the session, 6.76% over the past week, and 4.24% over the past three months. Compared to its 52-week high of $79.21, the current price sits at the 6.95% mark of its 52-week trading range. The stock trades above its 20-day moving average of $28.66 but remains slightly below its 60-day moving average of $29.99.
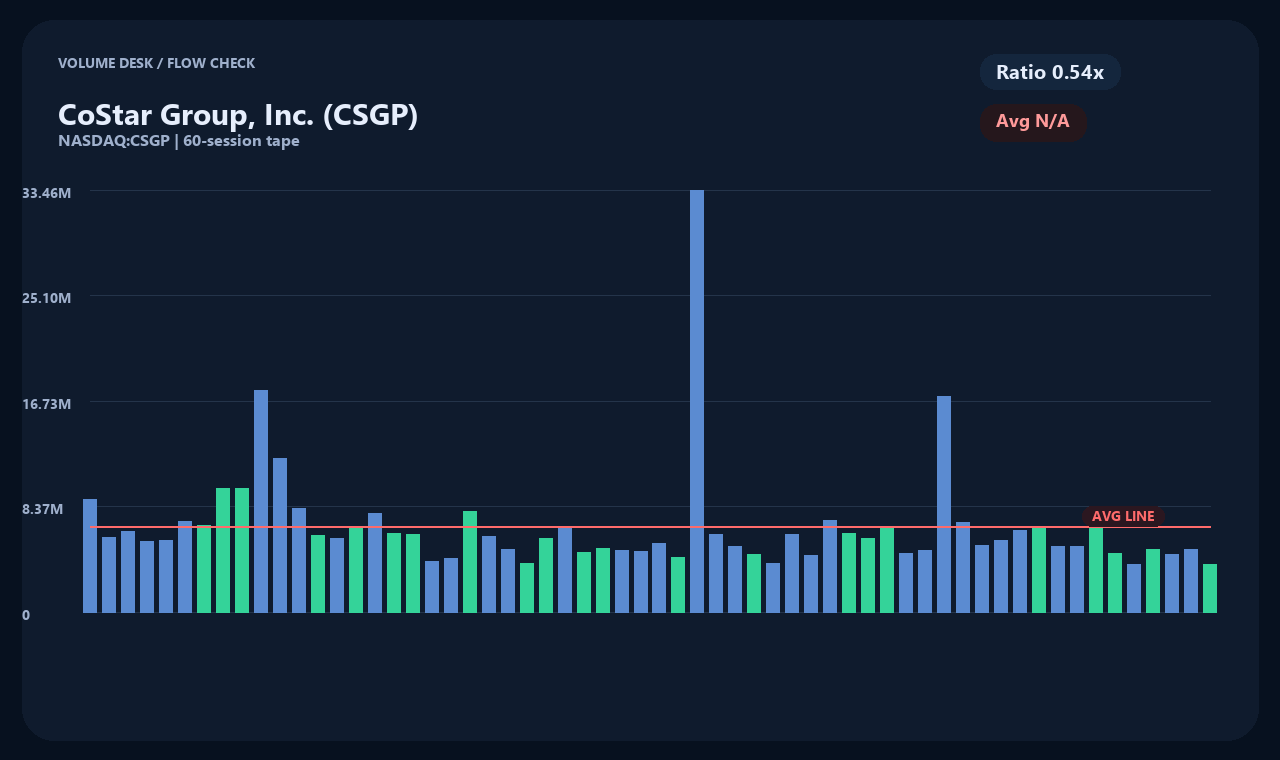
Trading volume totaled approximately 3.71 million shares on the day, representing roughly 54% of its average daily volume of 6.90 million shares. This light turnover indicates that despite the 7%+ price jump, the move lacked broad institutional volume confirmation. Just as rising volume does not inherently guarantee buying dominance, a short-term price increase on below-average volume suggests that further buying pressure is required to confirm a sustainable trend.
Institutional Perspectives and Financial Media Coverage
Reports from media outlets including Quartz and MarketWatch highlighted asset management firm Baillie Gifford naming CoStar Group as a candidate for a valuation rebound. Certain market observers argue that the extended selloff pushed the stock into oversold territory relative to its business fundamentals. Financial news commentary has echoed the premise that well-positioned companies with strong competitive moats can recover from severe price drawdowns.
Coverage from StockStory and MarketBeat similarly cited CoStar Group's durable business model and steady demand for its analytics platforms. However, institutional positioning and media commentary do not serve as definitive indicators of future stock performance. News reports reflect prevailing market sentiment at a given point in time; investors must separately evaluate whether operational performance metrics validate a long-term turnaround.
Upcoming Earnings Release and Key Catalysts to Monitor
According to press releases distributed via Business Wire, CoStar Group is scheduled to report its third-quarter financial results on October 27, 2026. Financial media including Barchart frame this upcoming earnings announcement as a critical catalyst for the stock's near-term direction. The report is expected to provide granular detail on Homes.com expenditure trends and user acquisition metrics.
Key variables that could reshape CoStar's valuation include margin expansion from reduced Homes.com marketing overhead and the recovery rate of commercial real estate transaction volume. If customer acquisition efficiency lags investment spending or marketing costs remain structurally high, net margins could face continued pressure. Conversely, evidence of concurrent top- and bottom-line growth across both residential and commercial platforms could trigger a broader market re-rating.
Market data timestamp (2026-10-09T04:02:19): Price $29.59 USD · 1D +7.23% · 1W +6.76% · 1M +0.05% · 3M +4.24%
[Sources and Timestamp]
Market data source: yahoo_chart_api · Timestamp: 2026-10-09T04:02:19. Media reporting references: StockStory, MarketBeat, Quartz. Media headlines serve as context for factual verification; primary corporate filings and announcements should be consulted independently.
This content is provided strictly for informational purposes and does not constitute investment advice or a solicitation to buy or sell securities.
This content is for informational purposes only and is not investment advice.

