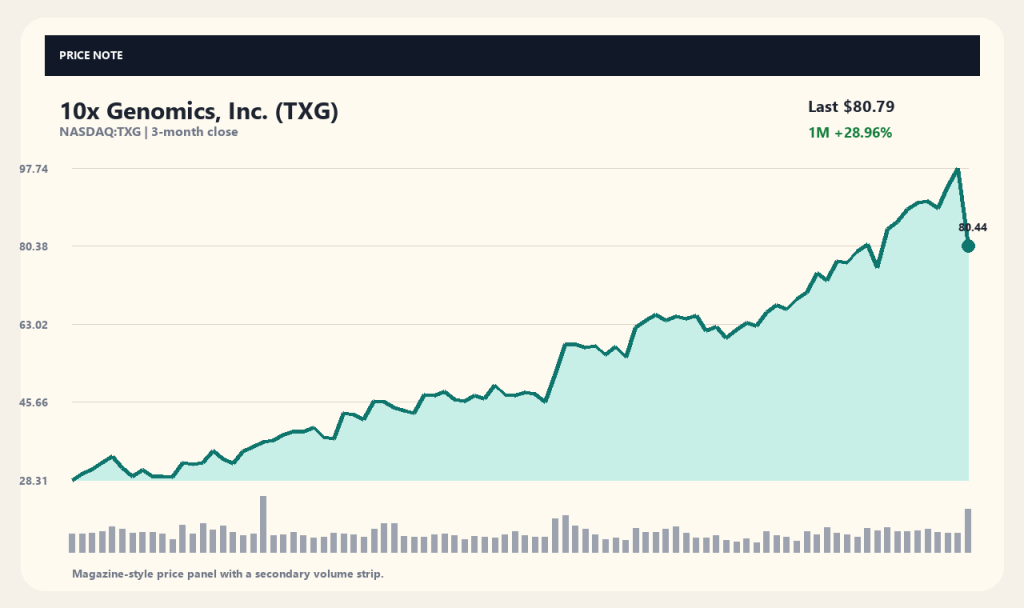
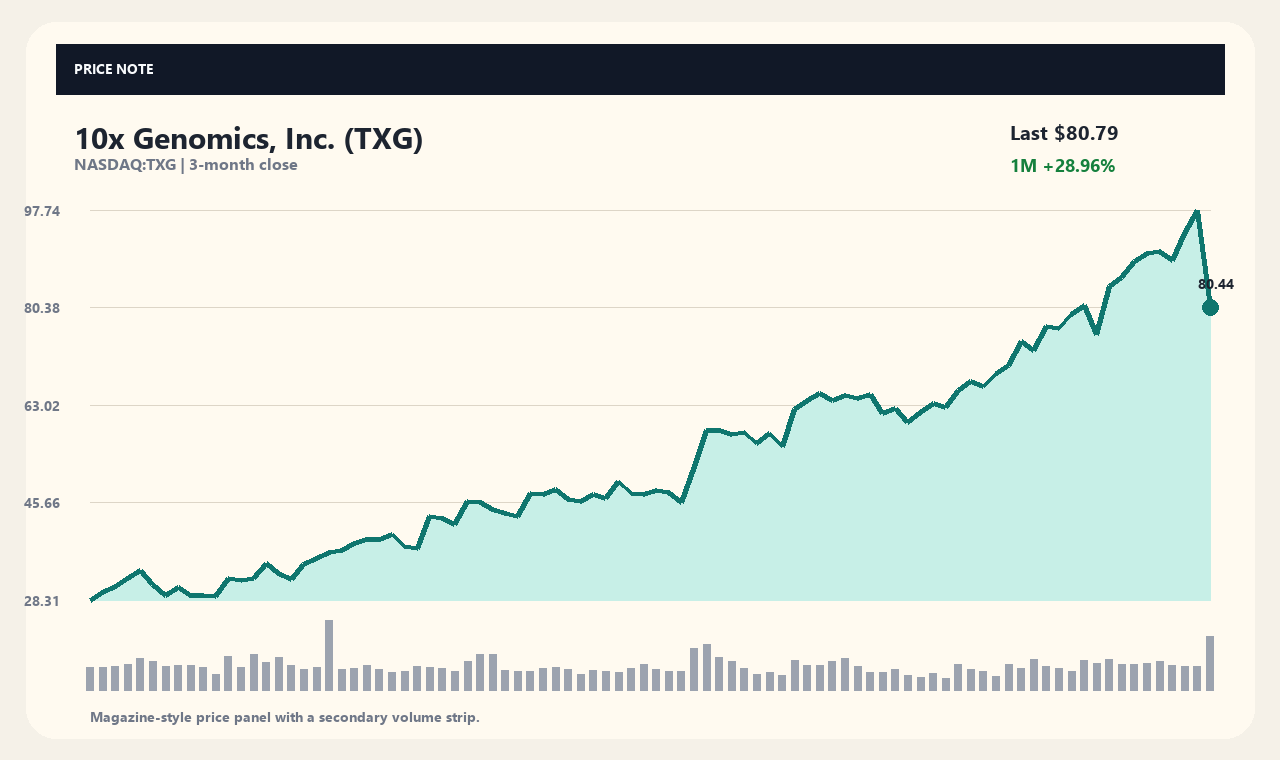
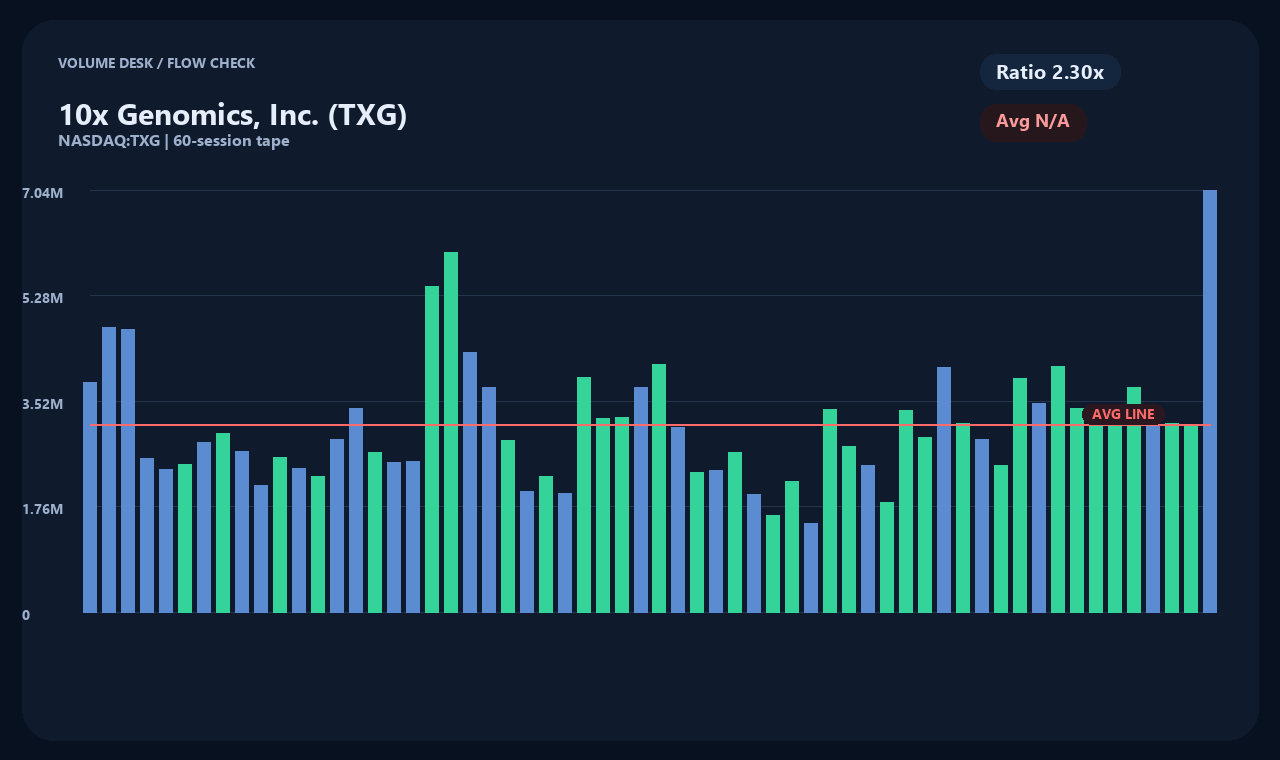
10x Genomics (TXG) stock plummeted 17.34% in a single session to close at $80.79, down sharply from the prior close of $97.74 on heavy volume of roughly 7 million shares—2.3 times its daily average. The sudden sell-off despite recent news of a new product shipment raises questions among investors about whether its bullish momentum can persist.
Despite the sharp short-term retreat, TXG's medium-to-long-term trend remains firmly positive, with shares up 28.96% over the past month and 115.62% over three months. Standing well above its 52-week low of $11.16, the key question is whether this pullback represents a temporary consolidation or a fundamental valuation adjustment against lagging financial results.
Launch of Atera and Demand in Spatial Biology Market
Reports from outlets including Zacks indicate that 10x Genomics has begun commercial shipments of its new product line, Atera. Expanding equipment and reagent deliveries amid growing demand for spatial biology applications marks an important operational milestone, building on its existing Chromium and Visium platforms to broaden its revenue base.
However, commentators such as Simply Wall St. question whether the positive catalyst of the new product rollout was already priced into the stock. Because new instrument shipments require time to convert into meaningful top-line growth, high expectations may have been baked in prematurely, making actual order momentum and revenue realization the primary test going forward.
Recent Financial Metrics and Valuation Uncertainties
Company profile metrics show 10x Genomics generating approximately $616.91 million in annual revenue alongside a net loss of roughly $75.12 million, with revenue shrinking 12.7% year-over-year. These figures highlight a divergence between enthusiasm for new product launches and concrete operational improvement.
On balance sheet health, the company maintains $552.03 million in cash against total debt of $78.79 million, alongside positive free cash flow of $179.65 million, indicating minimal short-term liquidity risk. Nevertheless, sustained upside in the stock may be capped unless profitability improves and sales growth rebounds.
Volume Spike and Technical Moving Average Position
Trading volume reached 6.99 million shares during the 17.34% drop, more than double the recent average of approximately 304 million shares, signaling heavy position turnover and heightened friction between buyers and sellers near peak price levels rather than one-sided pressure.
At $80.79, TXG is testing its 20-day moving average of $80.40 while holding 28.1% above its 60-day moving average of $63.07. While the broader uptrend remains intact, price action has pulled back to key average cost levels, making technical support around these historical levels a primary focus.
Unconfirmed Drivers Behind the Drop and Coverage Limitations
Despite the sharp 17%+ decline, available news coverage lacks official reports pinpointing a specific fundamental catalyst, with concurrent headlines focusing on Cathie Wood's ARKG ETF or executive changes at unrelated biotech firms instead of direct corporate news from TXG.
As a result, market commentary centers on prospective profit-taking and shifting trading flows, though the ultimate trigger cannot be definitively confirmed from current disclosures. Investors should exercise caution regarding unverified rumors until clear regulatory filings or order updates emerge.
Key Catalysts and Operational Metrics to Watch
Looking ahead, assessing TXG requires monitoring direct top-line contributions from the Atera platform. Upcoming quarterly earnings reports must demonstrate tangible revenue expansion and narrowing operating margin losses to resolve ongoing valuation concerns.
Furthermore, institutional budget trends and competitive shifts in spatial biology and single-cell analysis warrant continuous tracking. Absorbing overhead supply near the 52-week high of $102.81 and holding above the 20-day and 60-day moving average levels will serve as essential conditions for a trend stabilization.
As of collection time (2026-10-07T04:02:27): Price $80.79 USD · 1D -17.34% · 1W -10.27% · 1M 28.96% · 3M 115.62%
[Sources and Timestamps]
Market Data: yahoo_chart_api · Timestamp: 2026-10-07T04:02:27. Coverage Sources: Additional verification required. Article titles serve as factual leads and should be cross-referenced against official company announcements and filings.
This content is provided strictly for informational purposes and does not constitute investment advice or recommendations.
This content is for informational purposes only and is not investment advice.

