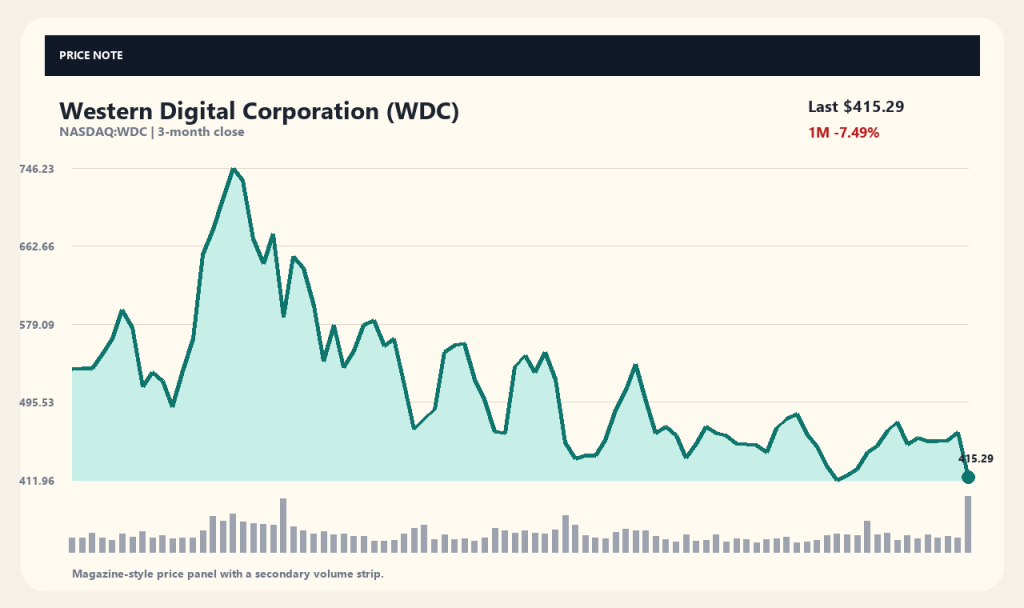
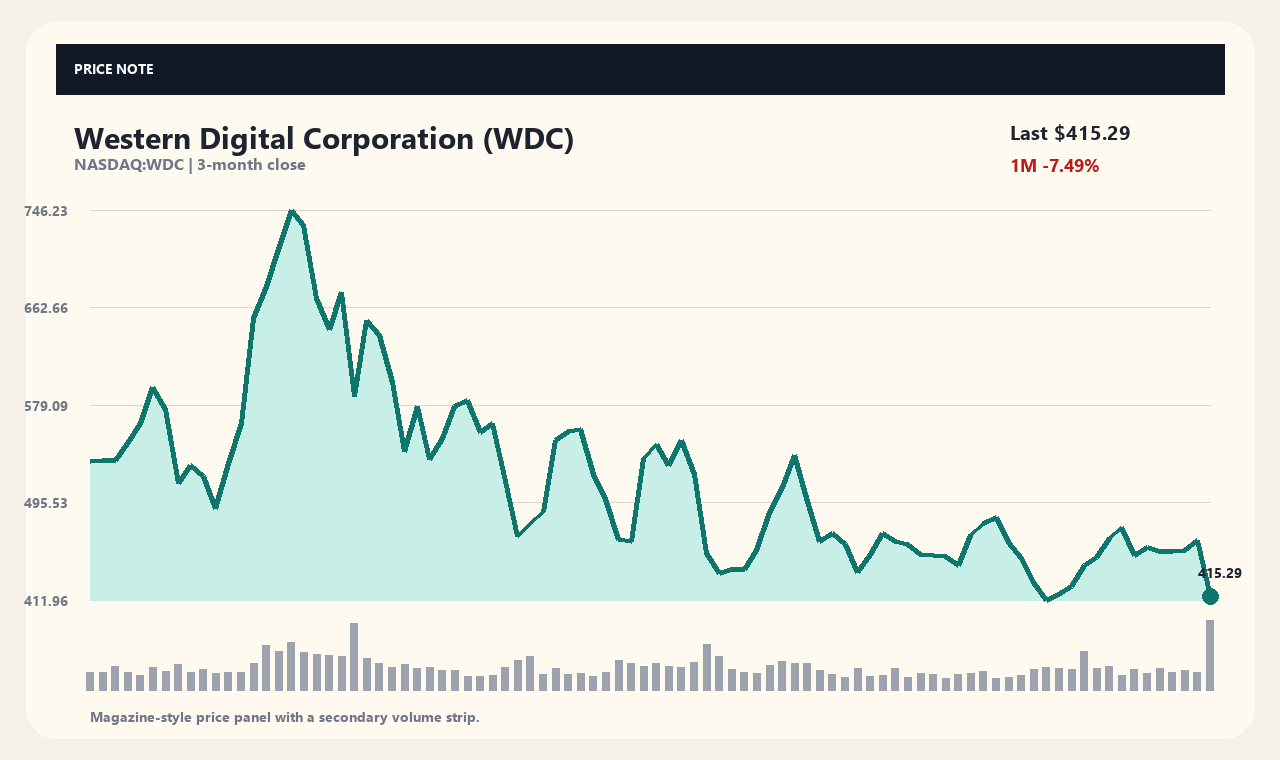
Western Digital Corp. (WDC) stock plummeted 10.22% in a single trading session to close at $415.29, dropping sharply from the previous close of $462.56, while trading volume surpassed 24 million shares—roughly 3.29 times its daily average. Market observers attribute the sell-off primarily to growing concerns that the hard disk drive (HDD) supply shortage could ease sooner than expected.
The steep drop dragged performance down to -9.09% over the past week, -7.49% over one month, and -28.08% over three months, pulling the stock well below its recent 52-week high of $799.87. Investors must now assess how changing supply and demand dynamics across the data storage industry could impact actual enterprise profitability.
HDD Supply Easing Outlook and Its Market Impact
Shares of Western Digital and Seagate both slipped as concerns spread among investors that hard drive supply constraints are loosening, according to Barrons.com. While the market previously expected persistent storage shortages driven by surging data center and AI demand, new forecasts suggest the supply-demand balance could normalize ahead of schedule.
The storage industry is characterized by significant average selling price (ASP) volatility tied directly to supply-demand imbalances. When shortages clear, price increases cool or face downward pressure, directly altering top-line revenue growth trajectories; these supply-easing concerns triggered a valuation multiple contraction on growth premiums previously priced in by the market.
Competitor Expansion Plans Fuel Market Concerns
Toshiba’s announced production expansion plans contributed to the downward pressure on Western Digital stock, according to Barchart. Capacity expansion and increased supply from major competitors expand total market output, raising the risk of price competition that can erode margins for key memory and storage manufacturers.
Western Digital manufactures and supplies data center HDDs and broader storage solutions globally. Capital expenditure trends and capacity expansion among global peers directly influence WDC’s market share and pricing power, prompting the market to evaluate whether these shifting competitive dynamics will weigh on mid- to long-term profit margins beyond short-term supply blips.
Heavy Volume Spike and Key Moving Average Breakdown
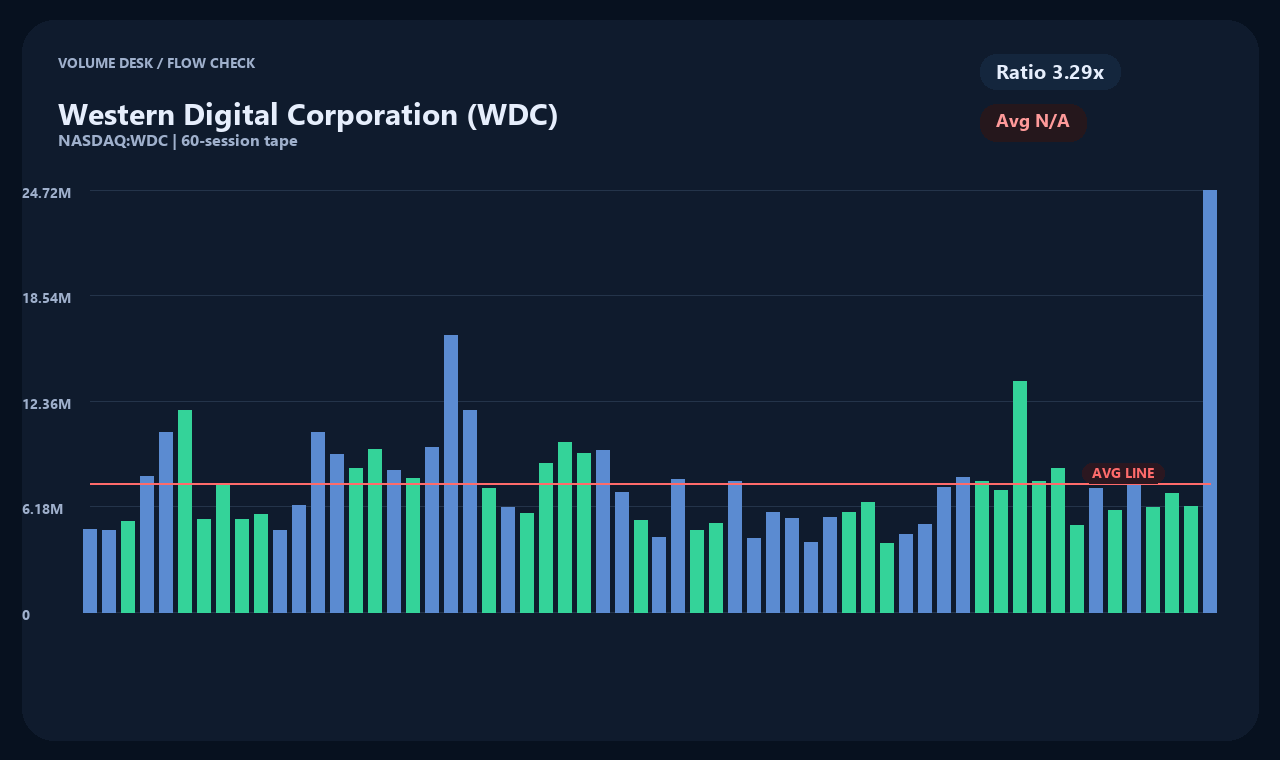
Trading volume surged during the sell-off to 24,651,005 shares, well above the average volume of 7,491,439 shares. A more than threefold volume spike indicates heavy selling pressure from market participants reacting to headline headwinds, though elevated turnover also reflects sharp institutional disagreement and share rotation rather than purely one-sided flows.
Technical charts show widening downside divergence from key moving averages. At $415.29, the current stock price sits 7.60% below its 20-day moving average of $449.44 and 12.93% below its 60-day moving average of $476.97; breaking below these short- and medium-term trendlines signals that overhead resistance may cap near-term upward momentum.
Financial Fundamentals and Core Valuation Metrics
According to compiled corporate data, Western Digital generated approximately $12.92 billion in total revenue and around $9.29 billion in net income. The stock trades at a trailing P/E of roughly 15.43x with a trailing EPS of $26.91, demonstrating baseline earnings generation, while operating cash flow stands at approximately $3.93 billion and free cash flow at $2.27 billion.
On the balance sheet, cash holdings of approximately $1.58 billion against total debt of roughly $1.19 billion provide strong defensive balance-sheet liquidity. However, because these trailing metrics reflect historical performance, investors cannot rely solely on past financials to project future earnings until upcoming earnings reports clarify supply shifts and product ASP adjustments.
Key Catalysts and Outlook Drivers to Watch
The key variable determining WDC’s trajectory remains the durability of real data center and AI storage demand. Expanding AI services, such as Google’s expanded free AI video tools, continue to stimulate storage demand according to Insider Monkey, though opinions differ on whether these growth catalysts are already fully priced into the market, making actual Hyperscaler capex trends critical to monitor.
Additionally, investors must track the exact timeline when competitor expansion capacity hits the market and monitor product ASP trends. Whether supply-easing fears remain a temporary sentiment shock or translate into real ASP declines and margin compression will serve as the primary fundamental test, making incoming quarterly results vital for verifying shipment volumes and price realization.
As of retrieval timestamp (2026-10-04T10:48:02): Price $415.29 USD · 1D -10.22% · 1W -9.09% · 1M -7.49% · 3M -28.08%
[Sources and Verification Timestamp]
Market data: yahoo_chart_api · Verification timestamp: 2026-10-04T10:48:02. Related reporting sources: Zacks, Insider Monkey, Motley Fool. Article headlines serve as verification clues; cross-check primary sources such as company press releases and official filings for full confirmation.
This content is provided strictly for informational purposes and does not constitute investment advice or recommendations.
This content is for informational purposes only and is not investment advice.

