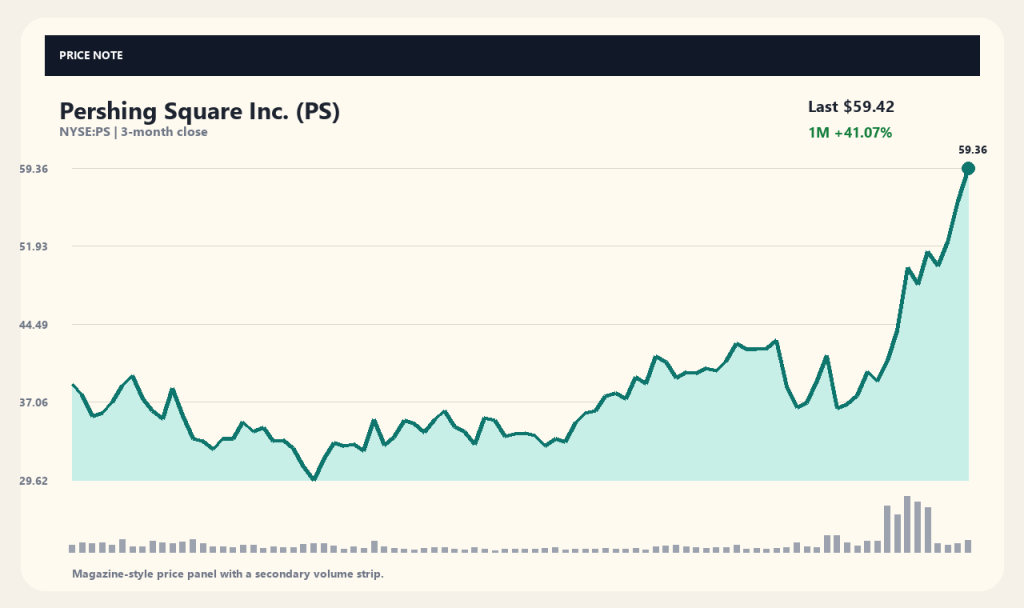
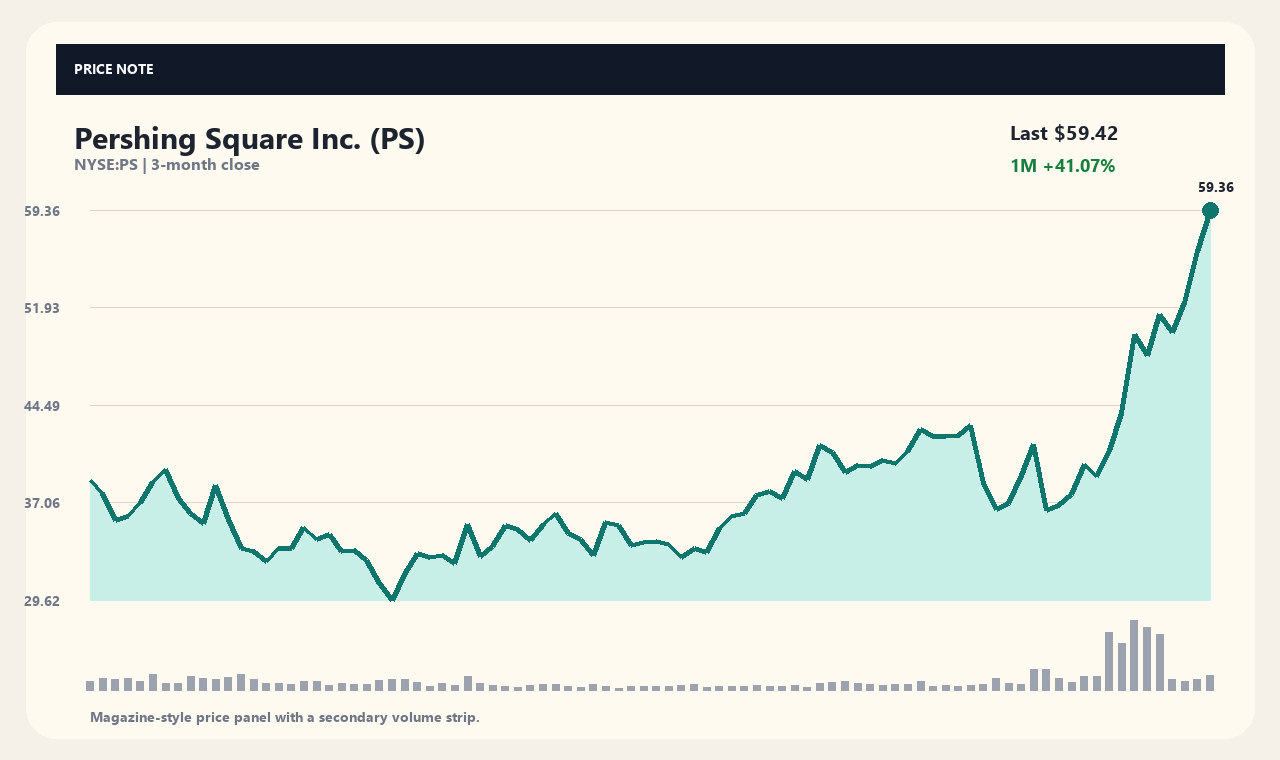
Pershing Square (PS) stock is drawing significant market attention as its strong upward momentum continues. On September 28, 2026, shares closed up 5.8% at $59.42, building on a massive run that has delivered gains of 41.07% over the past month and 79.03% over the past three months.
Investors are closely tracking how portfolio adjustments and public commentary from founder Bill Ackman could impact the asset manager's valuation over the long term. Interest has heightened following recent long-term updates on core holding Howard Hughes Holdings (HHH) and reports of shifts across tech holdings.
Insights on Major Holdings and Market Reaction
Recent media reports highlight Bill Ackman's perspective on Howard Hughes Holdings, which he described as a core asset poised to compound capital over the next 50 years. According to coverage from Benzinga and Barrons.com, this commentary was accompanied by executive insider buying at Howard Hughes.
Ackman's active sharing of investment thesis ideas is bolstering sentiment toward Pershing Square itself. Given the nature of asset management firms, stock price volatility often surges when market attention focuses on the valuation trajectory and strategy of key underlying holdings.
Big Tech Exposure and Portfolio Rebalancing News
Outlets including TheStreet and 24/7 Wall St. recently highlighted shifts in Pershing Square's large-cap tech and streaming exposure. Reports indicate the firm revealed a roughly $1 billion stake in Netflix after previously exiting the position, alongside weight adjustments across major AI and big tech assets.
Meanwhile, The Motley Fool noted that Pershing Square holds roughly 13% of its hedge fund portfolio in Uber, signaling confidence in its long-term growth prospects. These rebalancing reports continue to spark debate over the fund's capital efficiency and overall returns.
Current Price Level and Trading Volume Dynamics
According to Yahoo Chart API data, Pershing Square's 52-week high stands at $59.94, leaving its current $59.42 stock price trading at 98.63% of that peak. This marks a substantial rally from its 52-week low of $22.01 over the past year.
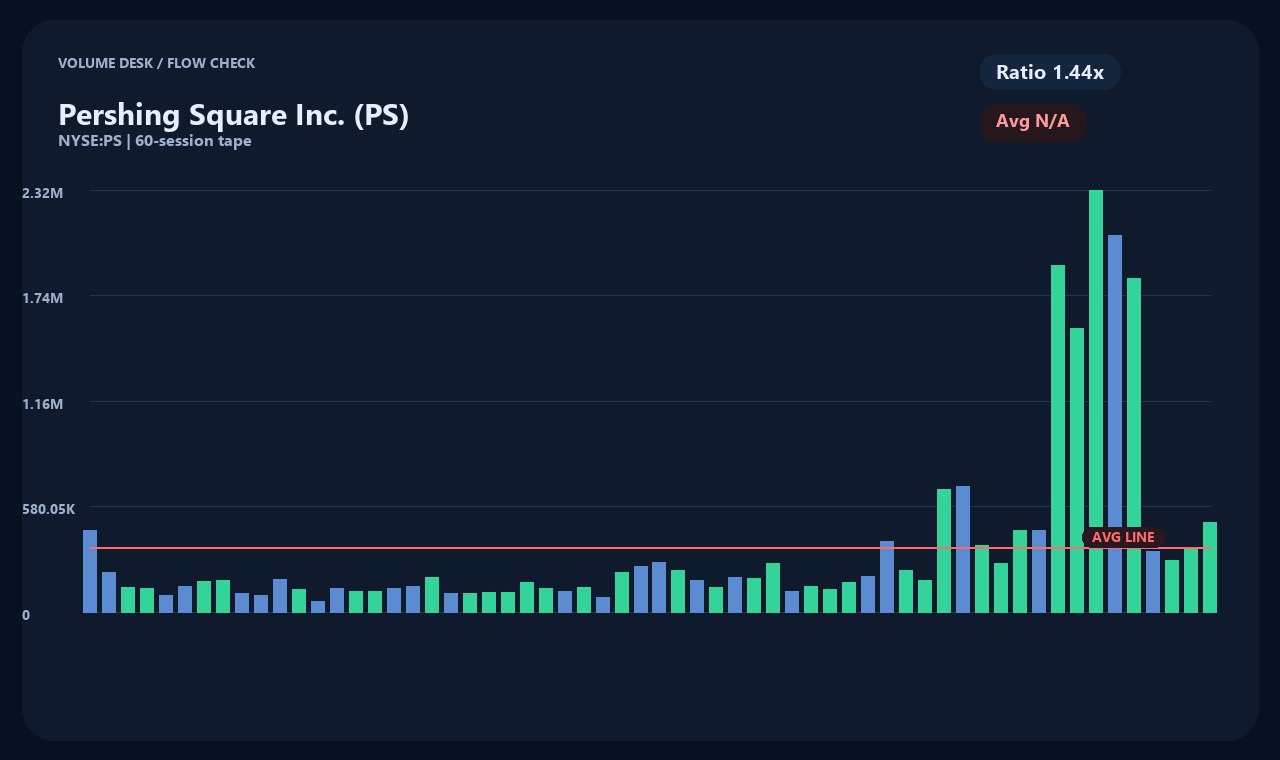
The stock is also trading well above key moving averages, standing 35.42% above its 20-day moving average ($43.88) and 51.46% above its 60-day moving average ($39.23). Trading volume reached 492,592 shares, about 1.44 times its average volume of 342,926 shares—a volume surge reflecting elevated market interest, though not definitive proof of institutional buying pressure.
Financial Metrics and Corporate Structure Features
Pershing Square operates as a financial services firm specializing in alternative asset management. Collected data indicates annual revenue of approximately $768.7 million and net income of around $16.09 million, with operating cash flow at roughly $172.21 million and free cash flow at about $153.76 million.
Traditional valuation metrics like trailing or forward price-to-earnings (P/E) ratios are currently unlisted or unavailable in the dataset. Because asset managers see performance swing sharply based on mark-to-market gains and losses across holdings, valuation requires a different framework than standard IT or manufacturing companies.
Key Variables for Investment Decisions
Outlets like Investor's Business Daily have highlighted Pershing Square's stock trajectory from a technical standpoint. However, short-term momentum and proximity to record highs do not guarantee future investment returns.
Evaluating Pershing Square's future stock performance requires tracking actual earnings reports and net asset value changes across its underlying portfolio companies. The manager's valuation will naturally shift alongside underlying asset performance and broader macroeconomic conditions.
Data as of collection time (2026-09-29T04:02:33): Price $59.42 USD · 1-Day +5.8% · 1-Week +23.2% · 1-Month +41.07% · 3-Month +79.03%
[Sources and Verification Timestamp]
Market data: yahoo_chart_api · Verification timestamp: 2026-09-29T04:02:33. News sources: Investor's Business Daily, Benzinga, Motley Fool. Article titles serve as fact-checking reference points; verify primary corporate filings and announcements for details.
This content is compiled for informational purposes only and does not constitute investment advice.
This content is for informational purposes only and is not investment advice.

