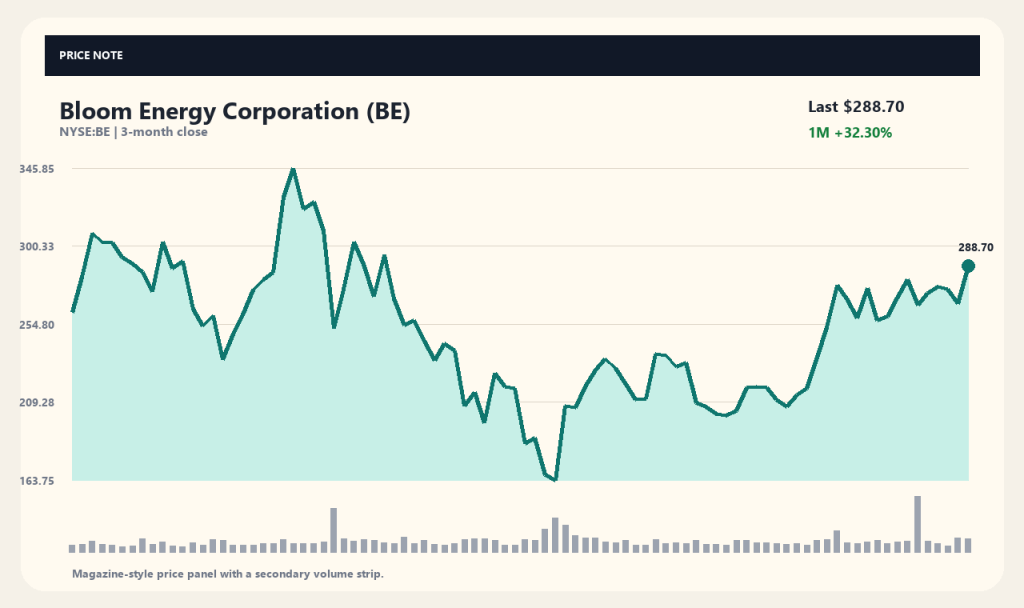
Bloom Energy (BE) stock surged 8.27% in a single session to close at $288.70, extending its one-month gain to 32.3% as the equity shows a strong short-term rebound. Easing concerns over its massive AI data center power agreement with Oracle triggered the rally.
Investors remain focused on the fallout from Oracle's force majeure declaration and the timing of actual revenue recognition. Market sentiment improved after Oracle reaffirmed its commitment to the ~2.4 GW Project Jupiter fuel cell contract; however, physical delays in pipeline construction remain a headwind to persistent earnings growth.
What Oracle’s Reaffirmation Means for the Market
Oracle's confirmation of the Project Jupiter contract removed a major overhang for Bloom Energy. Shares experienced heightened volatility after Oracle issued a force majeure notice due to natural gas pipeline installation delays, but anxiety dissipated quickly following Oracle's renewed commitment.
The episode highlights power demand from AI data centers as a primary growth catalyst for Bloom Energy. Because data centers consume immense amounts of power continuously, rapid grid connection is critical, positioning Bloom's solid oxide fuel cell (SOFC) technology as an attractive off-grid solution.
Natural Gas Pipeline Delays and Lingering Risks
Despite Oracle's reaffirmation, infrastructure delays affecting the natural gas pipeline cannot be resolved immediately. Building out the gas supply network involves external permitting and environmental factors that lie outside the immediate control of the companies.
Infrastructure bottlenecks directly impact Bloom Energy's revenue recognition timeline and cash flow generation. Delays in equipment delivery, installation, and power generation could push anticipated quarterly earnings into future periods, making pipeline construction progress a key monitoring point.
Recent Stock Performance and Technical Analysis
As of September 28, 2026, Bloom Energy closed at $288.70, up 8.27% from the previous close of $266.65. The stock has gained 8.69% over the past week and 14.55% over three months, trading at approximately 77.68% of its 52-week high of $351.28, while sitting 12.56% above its 20-day moving average ($256.50) and 23.74% above its 60-day moving average ($233.30).
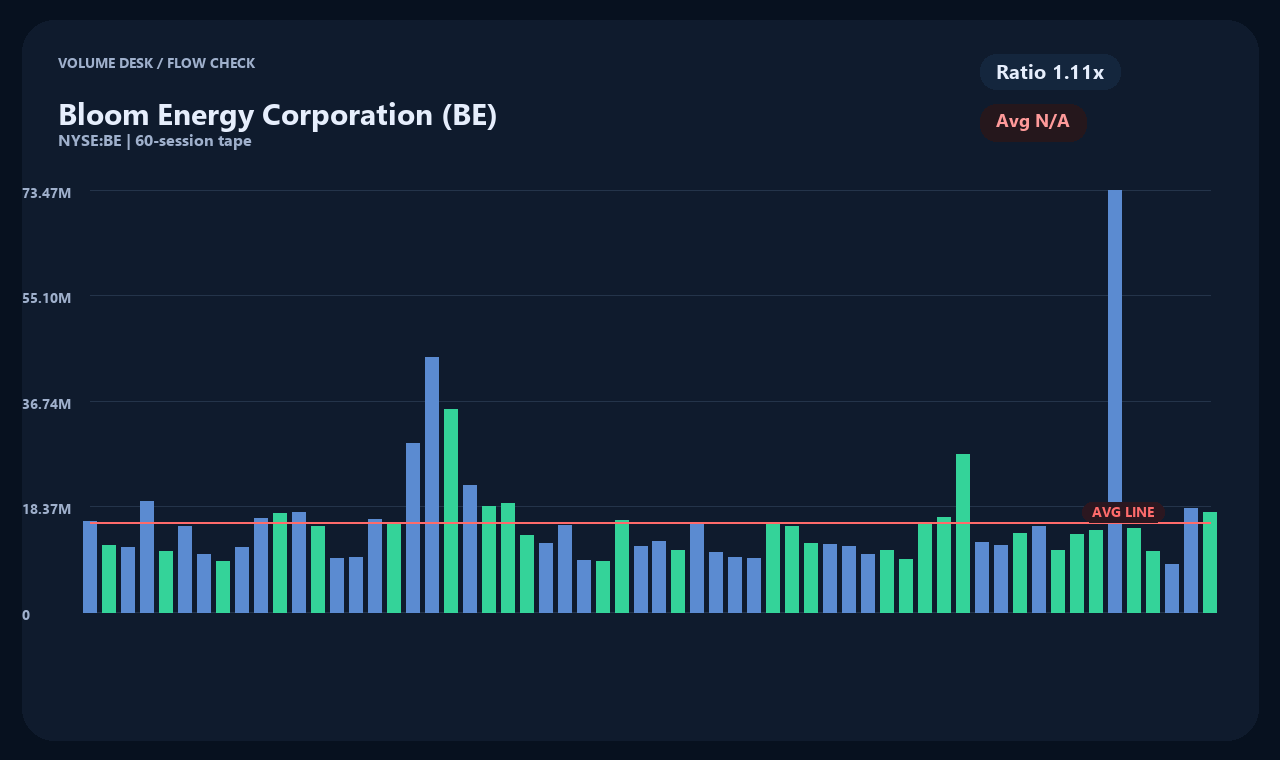
Trading volume reached roughly 17.3 million shares, about 1.11 times its average volume of 15.65 million shares, reflecting elevated investor interest driven by recent news flow. While trading above key moving averages reflects positive momentum, short-term volatility remains a consideration.
Financial Condition and Business Profile
According to Yahoo Finance annual summary data, Bloom Energy reported total revenue of approximately $3.113 billion and net income of about $244.94 million. Operating cash flow stood at approximately $737.78 million, with free cash flow reaching about $531.64 million, while total cash holdings of $2.717 billion roughly balanced total debt of $2.815 billion.
The company's core offering, the Bloom Energy Server, is an on-site platform that generates electricity from natural gas, biogas, or hydrogen via non-combustion electrochemical processes. Given the company's balanced cash and debt positions, converting large backlog orders into timely cash collection remains a crucial financial metric.
Key Drivers to Watch for Future Valuation
Execution speed on the Oracle project serves as a key fundamental catalyst for Bloom Energy's future market valuation. Investors will want to confirm that pipeline issues are resolved, equipment is delivered, and systems become operational alongside new order wins hitting quarterly financial reports.
Broad energy policy trends for data center infrastructure and competing power technologies will also influence market sentiment. Broader adoption of on-site power generation as a grid relief solution and stable natural gas market conditions will shape long-term valuation multiples.
As of data collection time (2026-09-28T04:02:23): Price $288.70 · 1-Day +8.27% · 1-Week +8.69% · 1-Month +32.3% · 3-Month +14.55%
[Source and Timestamp]
Market data source: yahoo_chart_api · Timestamp: 2026-09-28T04:02:23. News source reference: Investor's Business Daily. Article headlines serve as factual references; verify primary company disclosures and regulatory filings for full detail.
This content is provided for informational purposes only and does not constitute investment advice.
This content is for informational purposes only and is not investment advice.

