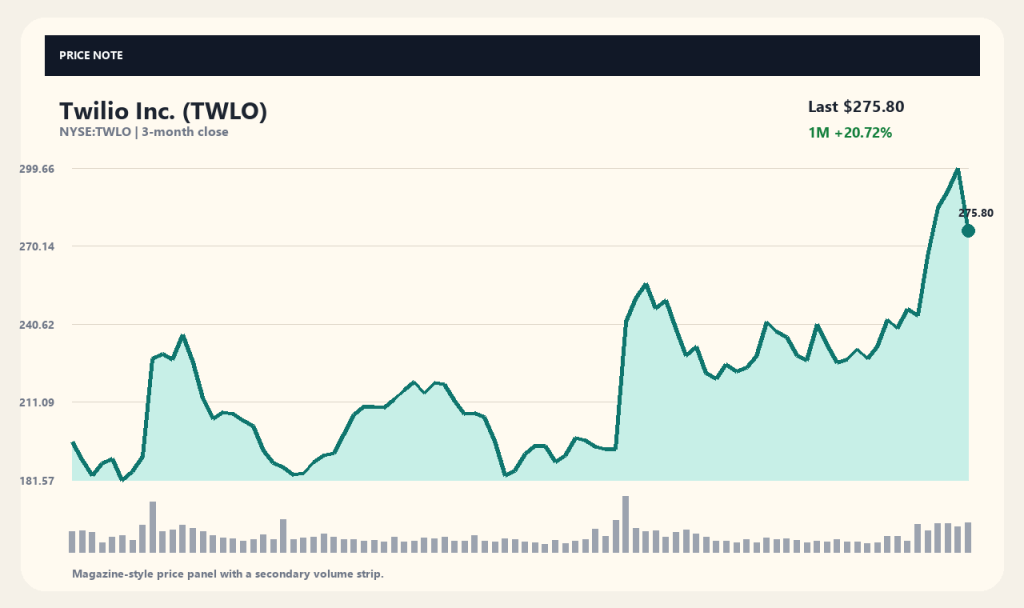
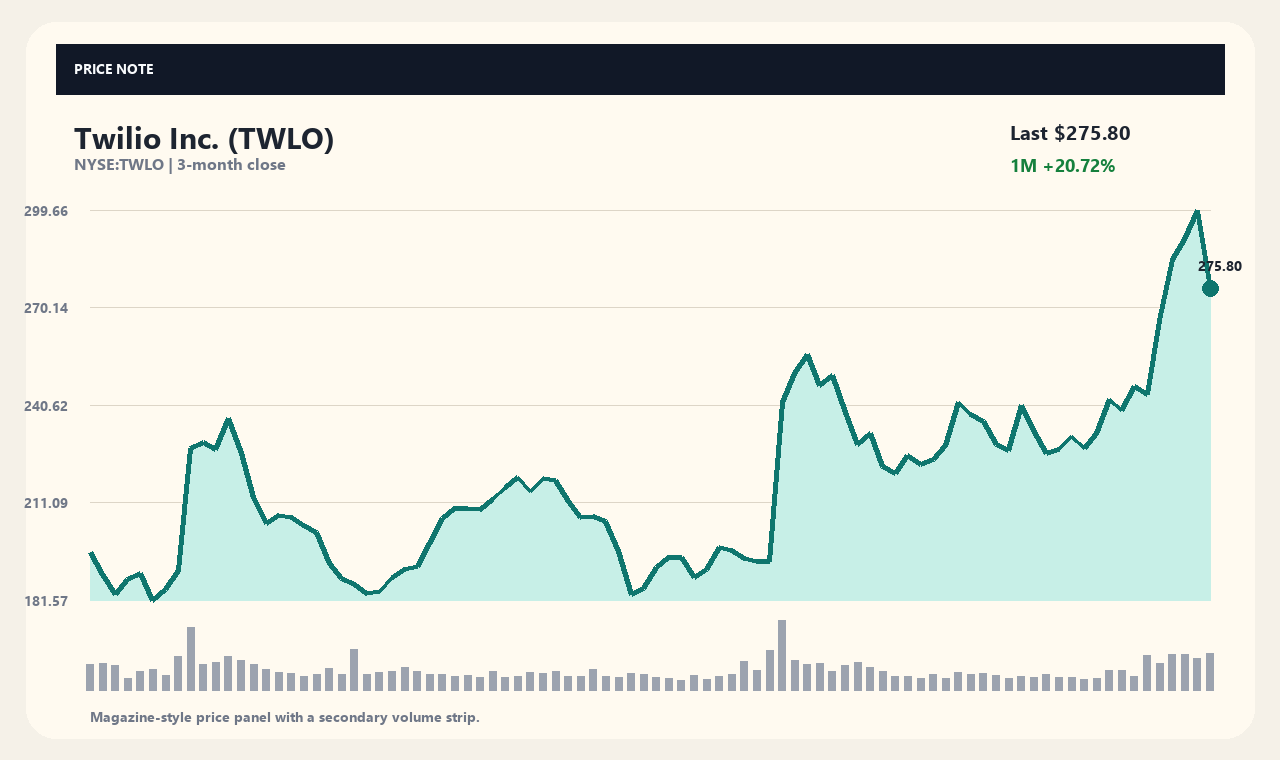
Cloud communications provider Twilio (TWLO) plunged 7.96% in a single session to close at $275.80. The sharp decline followed an HSBC downgrade of the stock from Hold to Reduce, accompanied by a $211 price target. Market participants are evaluating whether investors overstated the immediate revenue boost from Meta's Muse AI agent deployment.
Prior to the sell-off, Twilio maintained strong upward momentum fueled by its expanding AI communications suite. The stock was up 20.72% over the past month and 43.97% over three months, approaching its 52-week high of $304.75. However, HSBC's caution triggered a swift retreat as concerns surfaced over valuation stretch and the timeline for AI-driven revenue realization.
HSBC Downgrade and Caution on Meta's Muse AI
HSBC analyst Sameer Lam downgraded Twilio from Hold to Reduce, maintaining a $211 target price that sits approximately 25% below current trading levels. According to reports from Barrons.com and GuruFocus.com, the core rationale behind the downgrade is that Wall Street overvalued Twilio's early financial windfall from Meta's Muse AI agent integration.
Investors pushed shares higher on expectations that AI agent expansion would immediately drive massive messaging and voice API volume growth. HSBC warned, however, that a significant lag exists between rising AI traffic and actual revenue conversion, leaving current valuation metrics overly reliant on premature optimism.
Divergent Wall Street Views on AI Growth Drivers
Despite HSBC's cautious stance, broader Wall Street consensus leans constructive on Twilio's outlook. According to a report from Simply Wall St, the stock's estimated fair value was recently revised upward from $200.92 to $263.04, reflecting operational improvements across personalized AI agents and core communications software.
Investor's Business Daily highlighted Twilio's progress in transitioning from a commoditized messaging provider into a higher-margin AI growth driver. Analysts at Morgan Stanley and other investment firms identified Twilio as a beneficiary of Meta's Muse AI ecosystem, creating a sharp market debate between near-term valuation risk and long-term execution upside.
Financial Metrics and Fundamental Standings
According to Yahoo Finance data, Twilio generated approximately $5.57 billion in total revenue and $1.15 billion in net income. The company posted revenue growth of 22% and net income growth of 46.72%, reflecting expanding operating margins. Balance sheet liquidity remains solid, backed by $2.66 billion in cash against $1.07 billion in total debt.
The stock trades at a trailing P/E ratio of roughly 38.04, carrying a tech-sector premium relative to traditional software infrastructure peers. Diluted EPS stands at $7.25 alongside $954.68 million in free cash flow, indicating underlying core cash generation remains intact despite the recent market retreat.
Price Position and Trading Volume Surge
Twilio's 52-week range spans $98.44 to $304.75, placing its current price of $275.80 in the 85.97th percentile of that range. The stock trades 11.81% above its 20-day moving average ($246.68) and 22.55% above its 60-day moving average ($225.05), preserving its longer-term uptrend structure.
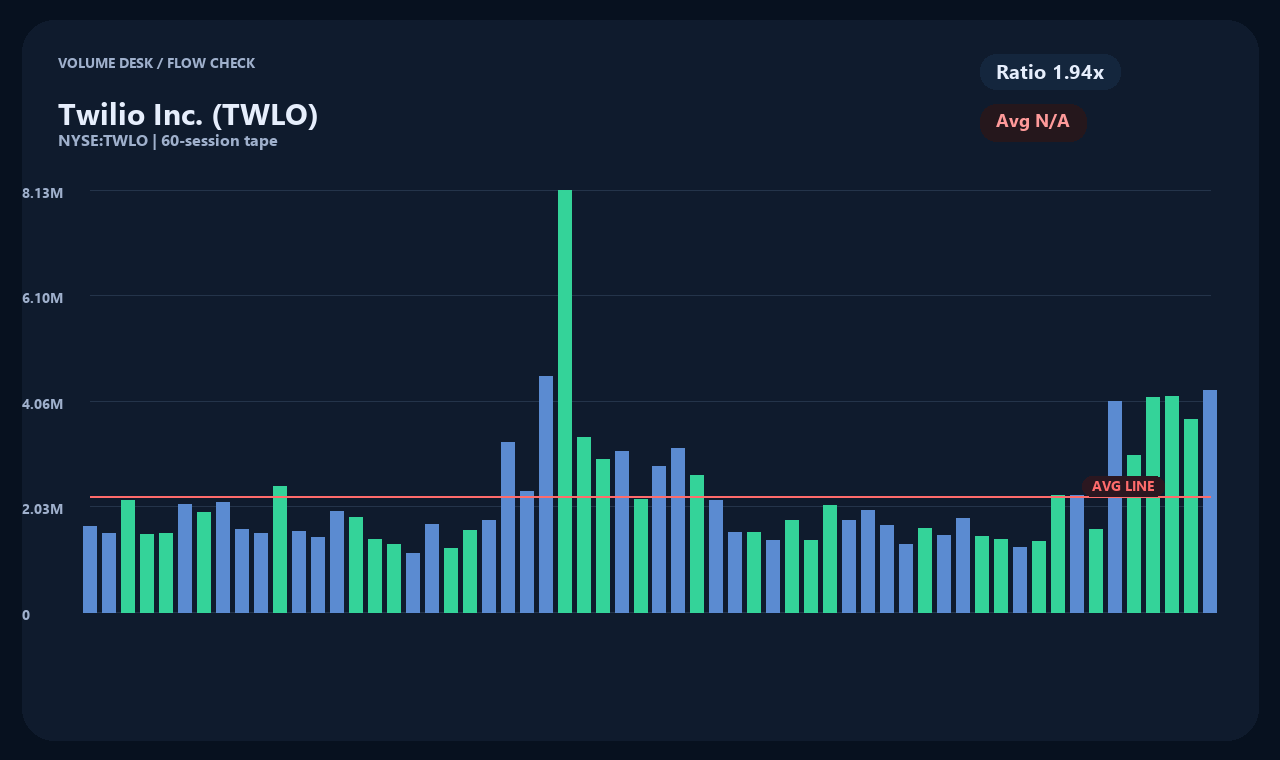
Daily trading volume surged to 4,257,428 shares, approximately 1.94 times its daily average of 2,198,533 shares. The volume expansion signals active selling following the rating downgrade alongside profit-taking near resistance levels after a extended rally.
Outlook and Key Watch Factors
The key catalyst for Twilio's near-term price trajectory will be whether AI agent adoption translates into tangible top-line growth. Investors will scrutinize upcoming quarterly earnings reports for measurable gains in messaging, voice API volume, and expansion in average revenue per account.
Wall Street focus will also center on narrowing the divide between HSBC's sell thesis and bullish consensus views. Continued margin expansion and growing AI revenue contribution will be required to defend current multiples, while execution delays could trigger further downside testing toward major moving averages.
Market Snapshot (As of 2026-09-27T04:02:29): Price $275.80 USD · 1-Day -7.96% · 1-Week +13.11% · 1-Month +20.72% · 3-Month +43.97%
Sources and Verification
Market Data: yahoo_chart_api · Retrieved: 2026-09-27T04:02:29. News Coverage Sources: Investor's Business Daily, StockStory. Article titles serve as reference pointers; verify details against official company filings and announcements.
This content is compiled for informational purposes only and does not constitute investment advice.
This content is for informational purposes only and is not investment advice.

