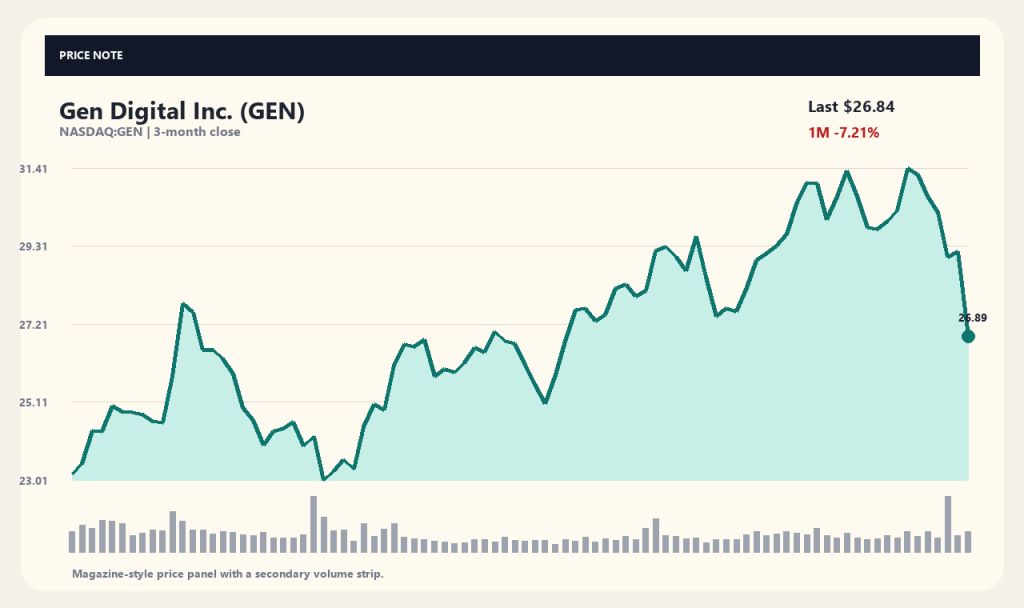
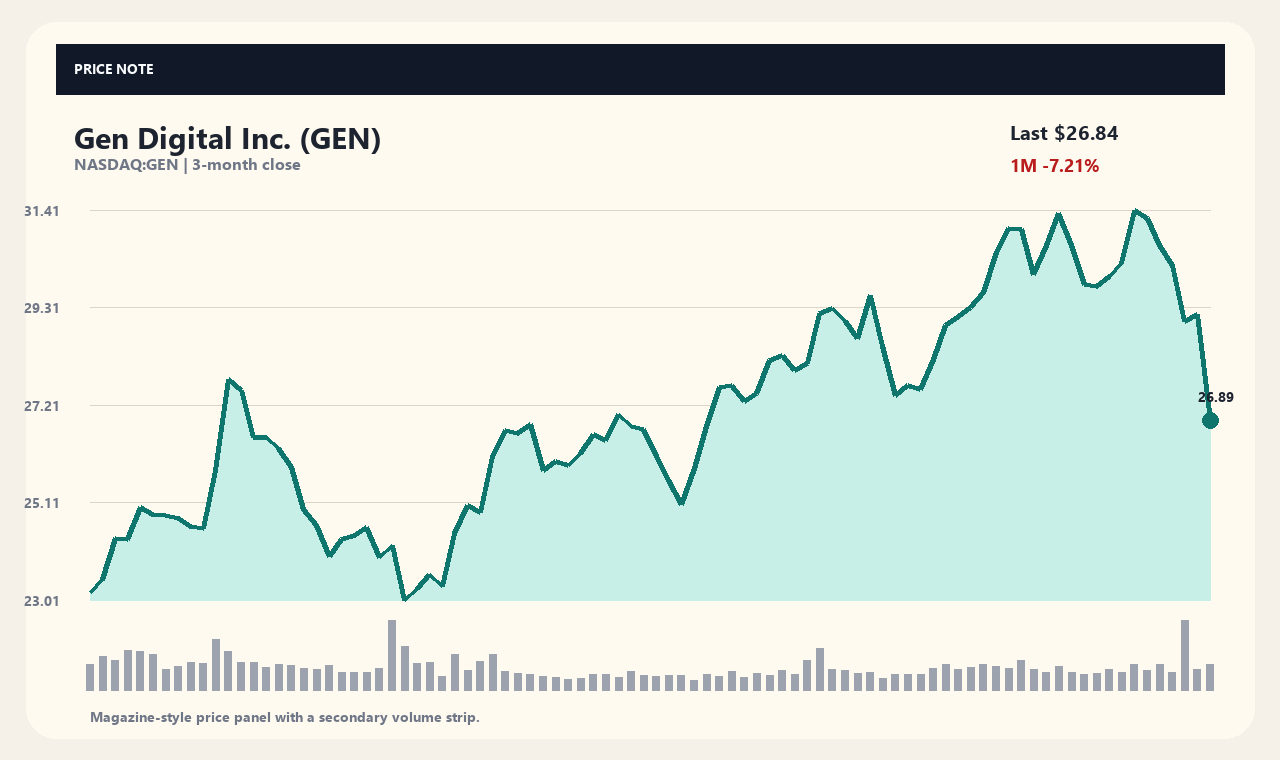
According to market data collected on September 23, 2026, Gen Digital Inc. (GEN) stock dropped 7.91% to close at $26.84, down from the previous session's close of $29.15. The stock has experienced heightened volatility, sliding 14.04% over the past week while maintaining a 15.41% gain over the past three months.
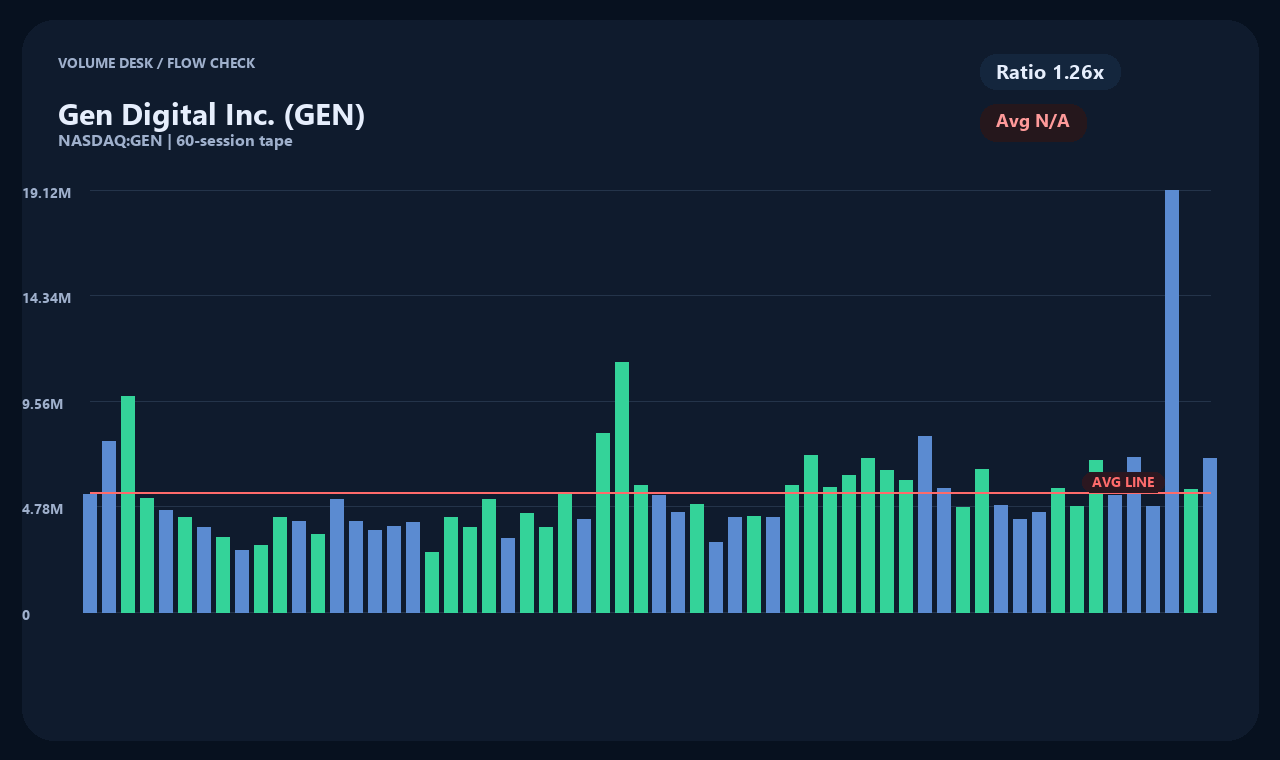
As shares underwent a sharp short-term pull-back, trading volume expanded to 6.88 million shares—approximately 1.26 times its average daily volume of 5.47 million shares. This elevated volume during a decline, coupled with a 1-month drop of 7.21%, has focused investor attention on the drivers behind the sell-off and the company's financial sustainability.
Strong Earnings Results and Upward Guidance Revision
Gen Digital recently delivered fiscal Q1 2027 earnings and revenue that topped Wall Street expectations. According to reports from Zacks and GuruFocus, bookings rose 11% year-over-year, pointing to resilient demand for its cybersecurity and digital trust solutions.
Building on these results, management raised its fiscal 2027 full-year revenue guidance to a range of $5.375 billion to $5.475 billion, while lifting its adjusted EPS outlook from $2.87 to $2.97. The upgraded targets suggest that the company's core operational fundamentals remain solid.
Executive Share Sales and Market Reaction
According to news coverage and SEC filings, Director Ondrej Vlcek sold a total of 452,000 insider shares across three transactions in August 2026. The sales included 100,000 shares near $28 on August 19, 152,000 shares near $29 on August 25, and 200,000 shares near $30 on August 27.
The final two sales alone totaled roughly $10.4 million as trade sizes scaled up. While insider selling can stem from personal financial planning, public filings showing management liquidating shares following a rally likely added overhead pressure on the stock's supply-demand dynamics.
Moving Averages and Technical Price Position
At $26.84, the stock currently sits 10.88% below its 20-day moving average ($30.12) and 4.73% below its 60-day moving average ($28.18). This divergence indicates that the short-term upward momentum built over the past month has broken down.
Trading between a 52-week high of $31.65 and a low of $17.78, the stock is currently positioned at 65.36% of its 52-week range. While shares have surrendered a portion of their 15.41% three-month gain, investors should note that technical indicators reflect past price action rather than guaranteed future performance.
Financial Structure and Cash Flow Breakdown
Over the trailing twelve months, Gen Digital generated approximately $5.079 billion in total revenue and $1.053 billion in net income, yielding a net profit margin of 20.73%. Cash generation remains a key strength, with operating cash flow reaching $1.570 billion and free cash flow (FCF) standing at $1.547 billion.
However, the balance sheet carries elevated leverage, showing $8.176 billion in total debt against $533 million in cash and cash equivalents. A core factor in assessing financial stability will be whether FCF generation remains strong enough to service debt obligations while sustaining shareholder dividend payouts ($0.13 per share).
Key Factors Shaping Future Stock Performance
Looking ahead, the primary catalyst will be whether Gen Digital can convert its raised full-year guidance into actual quarterly performance. Managing interest expense under a high-debt structure amid changing macroeconomic and interest rate environments remains a central variable.
Additionally, investors will be watching to see if insider selling pressure abates and if broader demand for cybersecurity software holds up. The stock's ultimate trajectory will likely depend on how effectively management balances top-line growth against its debt burden.
Data collected as of (2026-09-23T04:03:32): Price 26.84 USD · 1-Day -7.91% · 1-Week -14.04% · 1-Month -7.21% · 3-Month 15.41%
[Source and Verification Time]
Market data provided by yahoo_chart_api as of 2026-09-23T04:03:32. Related news reports require further verification. Headline details serve as research references and should be cross-checked against primary company filings and official press releases.
This article is provided for informational and educational purposes only and does not constitute investment advice or a solicitation to buy or sell securities.
This content is for informational purposes only and is not investment advice.

