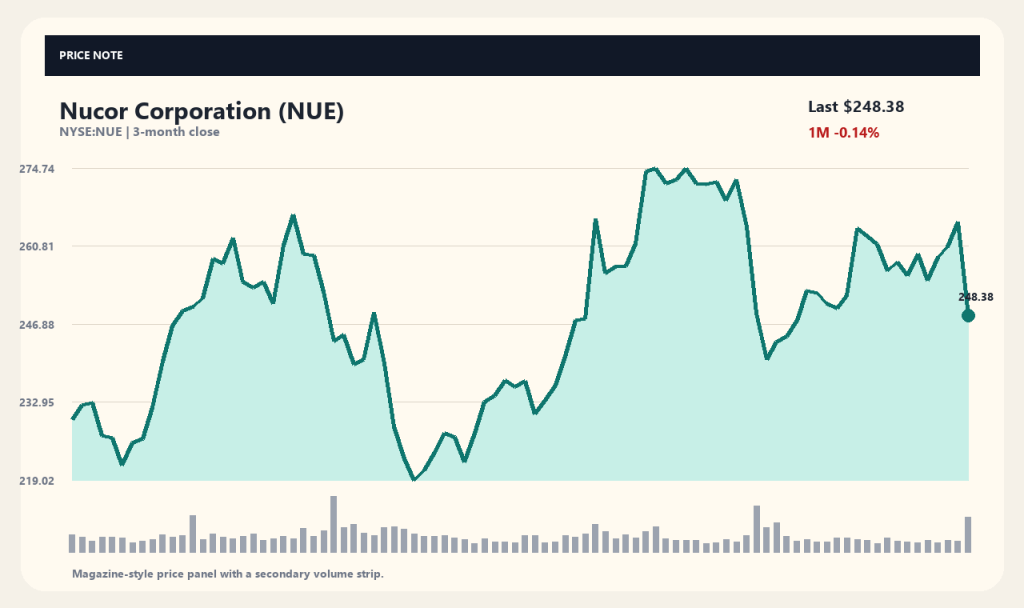
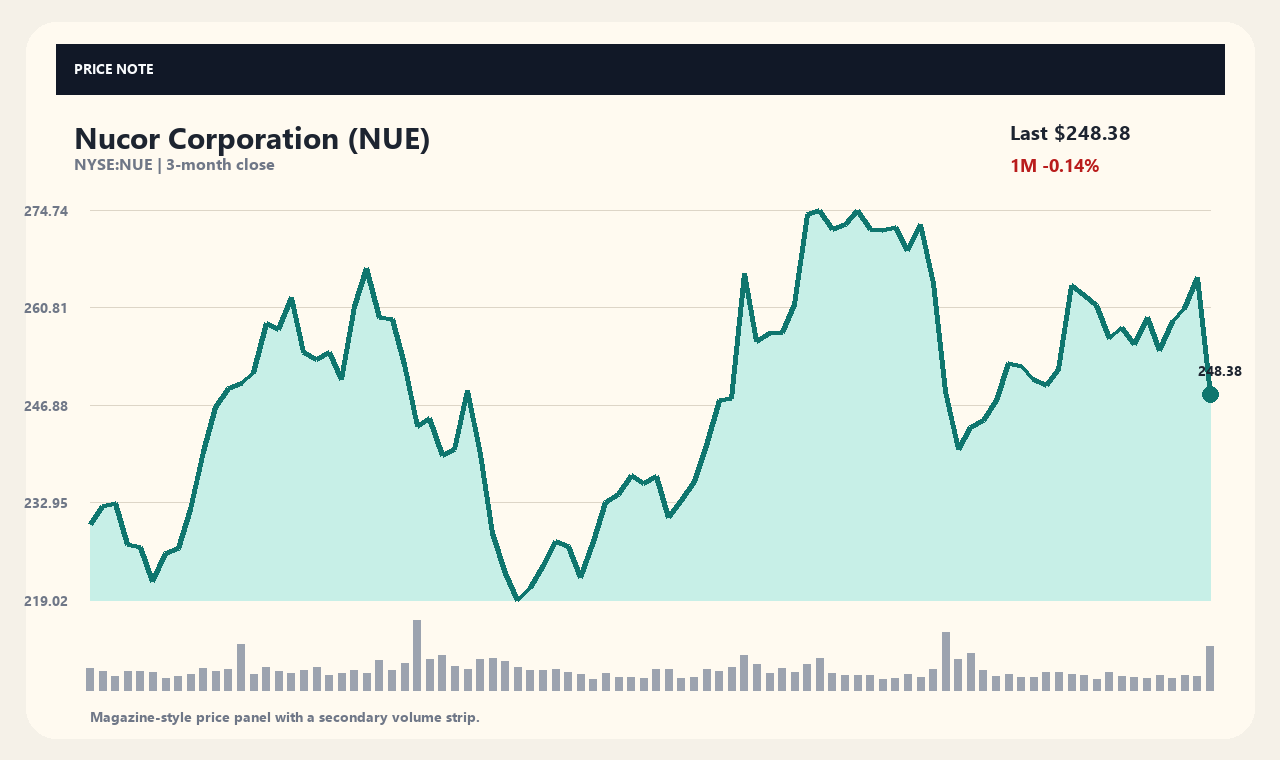
Shares of Nucor Corporation (NUE), one of the largest steelmakers in the United States, dropped 6.32% in a single trading session to close at $248.38. The stock fell $16.76 from its previous close of $265.14, extending its one-week loss to -4.26%. Market participants actively reacted to Nucor's recent business update highlighting a weaker revenue outlook for its raw materials segment alongside shifting macroeconomic conditions.
Investors are closely watching whether this sharp drop signals a brief pullback or a broader cyclical downturn across the steel industry. The sell-off appears to stem from a combination of segment-specific headwinds within Nucor and broader macroeconomic pressures, including rising U.S. Treasury yields. Evaluating the key issues requires analyzing available financial data and recent market coverage.
Raw Materials Guidance and Core Business Operations
Nucor operates as a diversified steel manufacturer across three main business segments: steel mills, steel products, and raw materials. According to recent social media and market commentary, Nucor signaled potential declines in revenue and earnings for its Raw Materials segment in a recent update. Profitability headwinds in raw materials, which encompasses direct reduced iron (DRI) production and scrap processing, could weigh on overall operating income.
However, Nucor's flagship Steel Mills segment supplies a wide array of products—including bar and sheet steel—to U.S. and North American markets, which may partially offset weakness in a single division. Furthermore, the Steel Products segment, which includes structural tubing and solar racking components, remains tied to broader infrastructure demand. A critical factor for future performance will be whether margin gains in steelmaking and products can counter the slowdown in raw materials.
Macroeconomic Factors and Treasury Yield Volatility
Broader U.S. equity markets have recently experienced increased volatility driven by shifting Treasury yields. According to reporting from major outlets including MT Newswires, the 10-year U.S. Treasury yield topped 5% or approached multi-year highs, creating headwinds across the stock market. Rising interest rates increase borrowing costs for capital-intensive manufacturers like steel producers while dampening demand in key downstream sectors such as construction.
Market coverage from Barrons.com highlighted Nucor alongside high-profile movers like Netflix and On Holding. The combination of sustained high interest rates, volatile crude oil prices, and geopolitical uncertainties has amplified macroeconomic headwinds. These broader financial conditions appear to have intensified Nucor's single-day decline beyond its company-specific updates.
Trading Volume Surge and Key Technical Indicators
As of September 20, 2026, Nucor's stock price of $248.38 sits at approximately 78.67% of its 52-week high of $280.11. While remaining well above its 52-week low of $131.32, the recent pull-back pushed the share price below key moving averages. The stock currently trades -2.55% below its 20-day moving average ($254.87) and -0.61% below its 60-day moving average ($249.90).
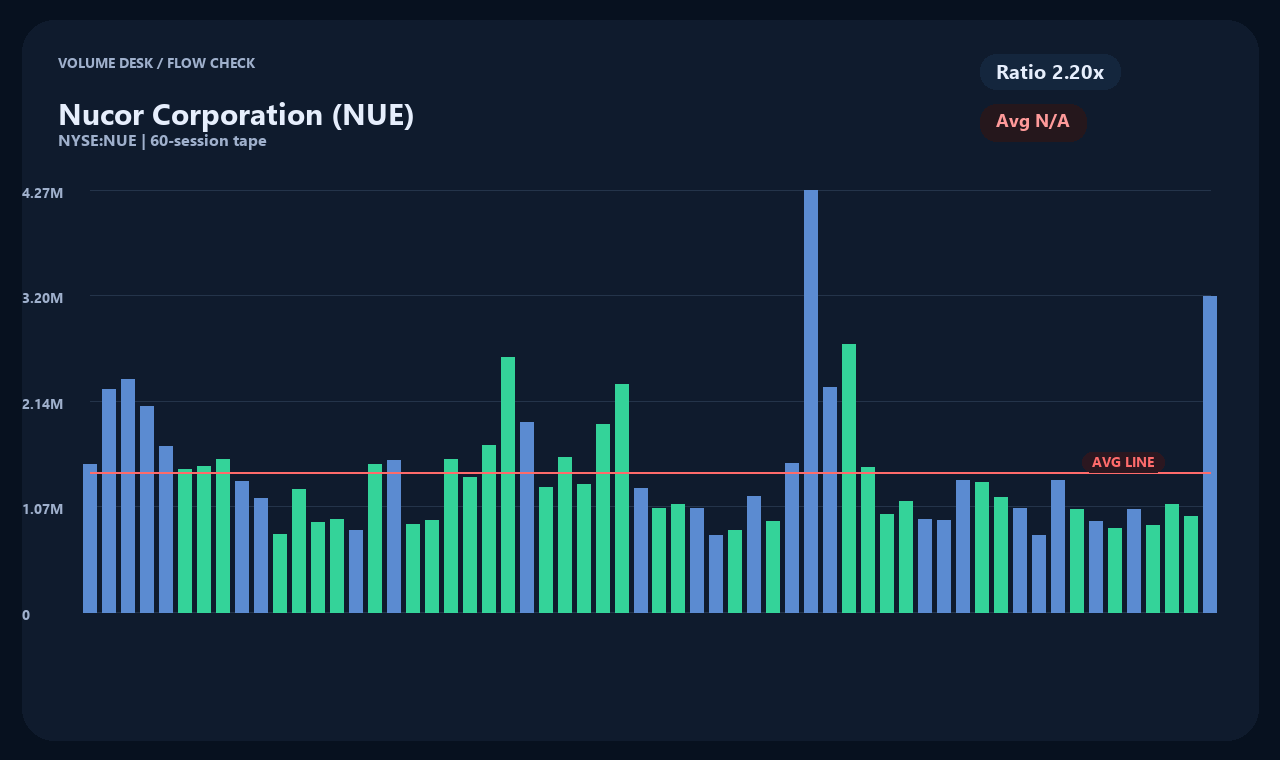
Trading volume surged to 3,194,364 shares, roughly 2.2 times its average daily volume of 1,451,992 shares. From a technical chart perspective, analysts note resistance near the $270 level preceding the decline, though historical price action does not guarantee future moves. The surge in volume reflects intense market debate and elevated trading activity rather than a one-sided buying or selling signal.
Financial Structure and Balance Sheet Health
According to financial overview data from Yahoo Finance, Nucor generated approximately $36.1 billion in annual revenue and $2.87 billion in net income over its latest fiscal year. The company has maintained steady profitability metrics with operating and net margins supporting a trailing 12-month earnings per share (EPS) of $12.52. Based on historical performance, the trailing price-to-earnings (P/E) ratio stands at approximately 19.84x.
Nucor holds approximately $2.69 billion in cash and cash equivalents against total debt of roughly $7.09 billion. Robust annual operating cash flow of $4.42 billion provides a solid liquidity cushion to absorb short-term operational fluctuations. However, any sustained weakness in downstream demand that dampens cash generation could increase debt-servicing friction over time.
Key Factors to Watch and Analytical Limitations
Determining Nucor's future stock trajectory will require analyzing detailed figures in upcoming quarterly earnings releases rather than relying solely on immediate price action. The primary focus remains the total impact of raw materials margin compression on consolidated operating income and whether higher steel mill shipments or pricing power can absorb the loss. Broader global steel demand and the pace of U.S. infrastructure spending will also serve as vital variables.
Available preliminary data does not confirm whether Nucor's decline represents a sustained trend or a brief correction. High-level market commentary and media reports often lack detailed segment guidance numbers or confirmed earnings release dates. Consequently, investors should closely monitor upcoming official financial statements and executive management commentary.
Market data snapshot as of collection time (2026-09-20T04:02:22): Price $248.38 USD · 1-Day -6.32% · 1-Week -4.26% · 1-Month -0.14% · 3-Month +1.87%
Sources and Verification Timestamp
Market Quote Data: yahoo_chart_api · Timestamp: 2026-09-20T04:02:22. Related News Source: MT Newswires. Media headlines serve as directional references; verify against official company filings and announcements.
This article is intended for informational purposes only and does not constitute investment advice or a solicitation to buy or sell securities.
This content is for informational purposes only and is not investment advice.
 StockBrief