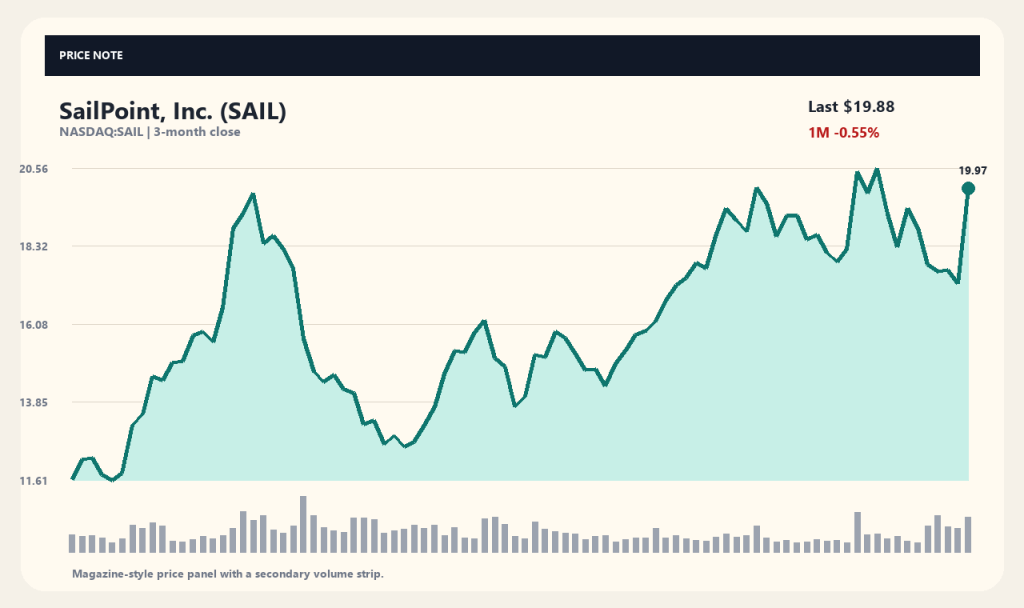
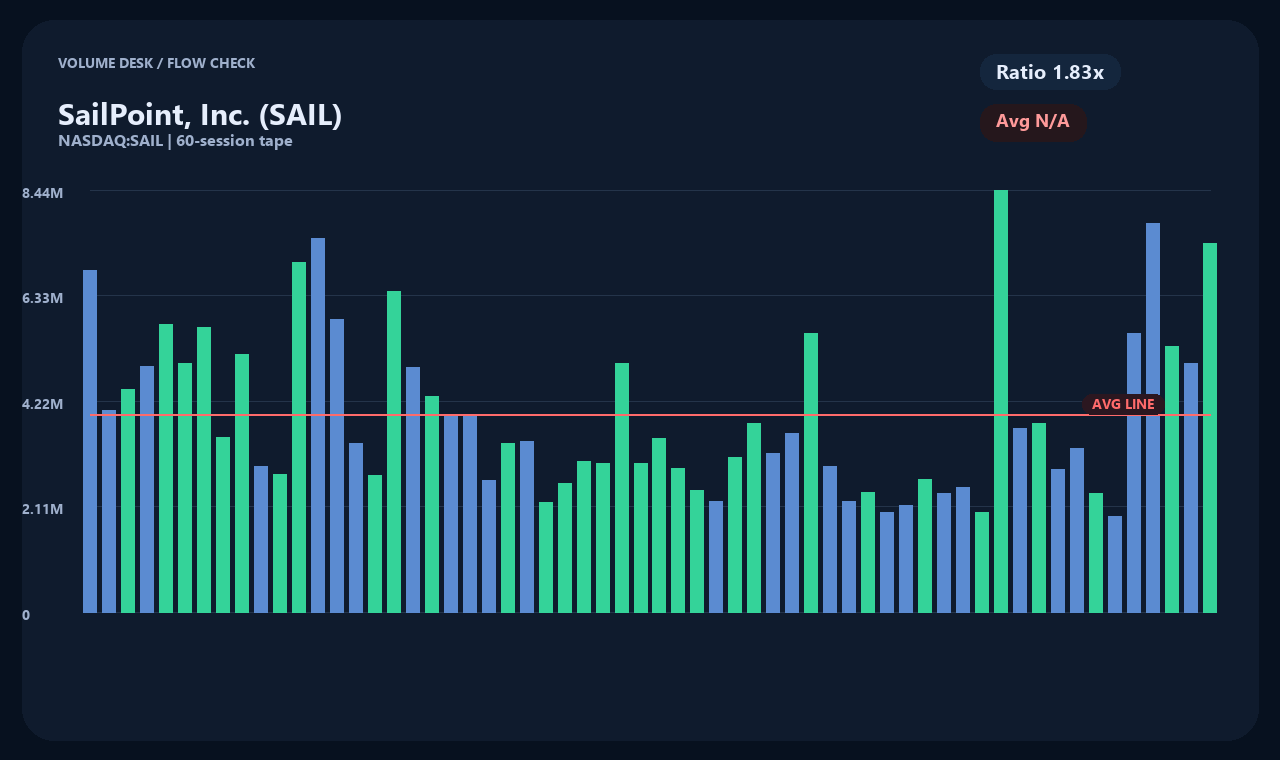
SailPoint, Inc. (SAIL) captured market attention after jumping 15.31% in a single session to close at $19.88. The sharp rally from the previous close of $17.24 was accompanied by elevated trading volume, with 7,337,675 shares traded—roughly 1.83 times its average daily volume.
Driving the price action was Wall Street's reaction to the company's Q2 fiscal 2027 earnings release and updated full-year outlook, announced on September 9, 2026. Following a 5.63% gain over the past week and a 35.98% rally over three months, investors are closely examining which fundamental metrics sparked this latest surge.
Subscription Metrics Drive Top-Line Expansion
According to company reports, SailPoint's total Annual Recurring Revenue (ARR) for Q2 grew 25% year-over-year to $1.231 billion. The primary growth engine was SaaS ARR, which expanded 36% year-over-year, leading the overall top-line momentum.
The company also disclosed that AI-related ARR surpassed $70 million, accounting for more than 30% of net new ARR additions. On the back of these results, management raised its full-year ARR guidance to approximately $1.38 billion, establishing a higher bar for future operational performance.
Mixed Media Reaction Post-Earnings
Financial media outlets offered differing takes on the detailed earnings report. Outlets including MT Newswires and GuruFocus highlighted the positive catalysts, pointing to strong ARR delivery, growth in AI product suites, and the raised full-year guidance.
Conversely, Barron's emphasized that reported revenue fell short of consensus expectations, discussing how that top-line miss affected broader stock sentiment. This divergence highlights how the market is weighing strong SaaS expansion against near-term revenue targets.
Cumulative Financial Health and Profitability Profile
Looking at historical financial performance, SailPoint generated total revenue of approximately $1.16554 billion alongside a net loss of $197.22 million, translating to a net margin of -16.92%. Basic earnings per share (EPS) stands at -$0.34, reflecting ongoing net profitability headwinds.
However, underlying cash generation remains solid, with free cash flow (FCF) reaching approximately $339.25 million and operating cash flow at $200.64 million. Furthermore, the balance sheet displays structural stability, backed by $309.85 million in cash against just $31.36 million in total debt.
Technical Moving Averages and Volume Breakdown
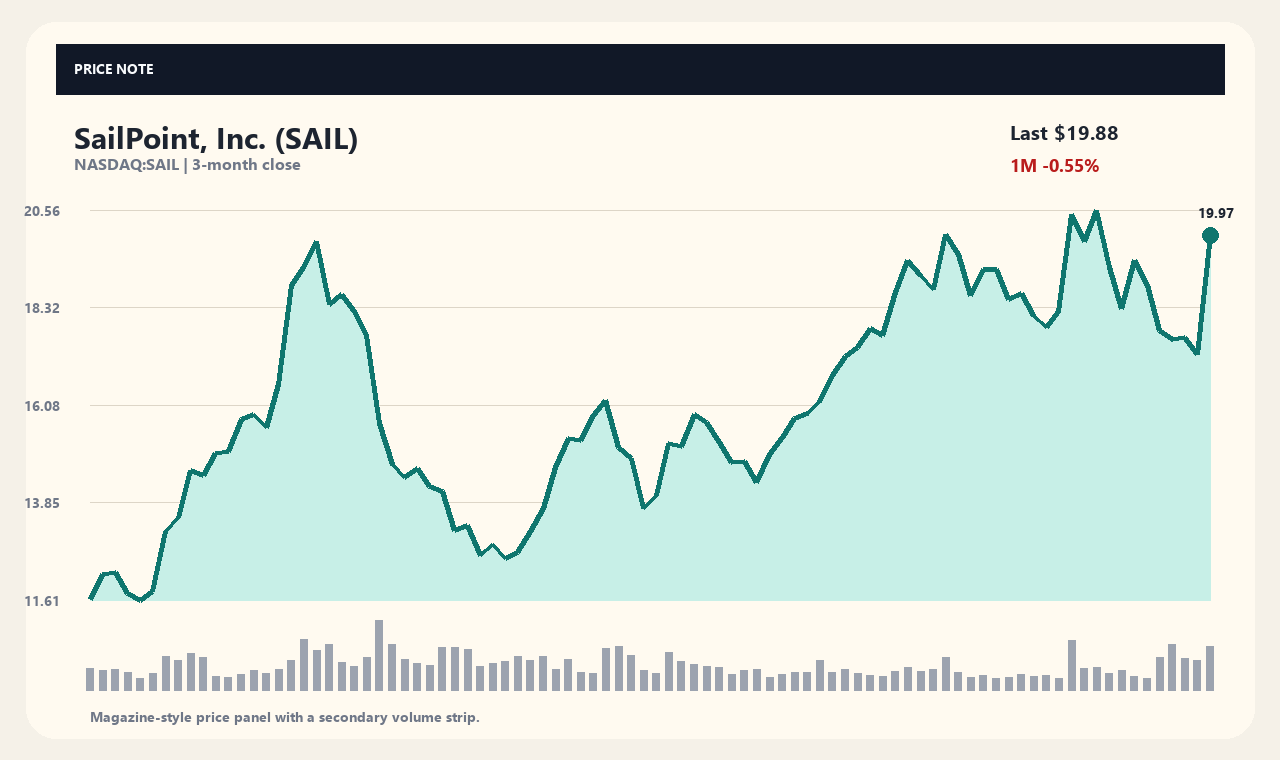
At the recent close of $19.88, the stock trades 6.01% above its 20-day moving average ($18.75) and 19.0% above its 60-day moving average ($16.71). Positioned within its 52-week trading range of $10.30 to $24.00, the stock currently sits at 69.93% of its 52-week high-low span.
While a volume spike of 1.83 times the average indicates robust short-term market engagement, it does not definitively signal exclusive buyer dominance or guaranteed further upside. The stock had traded flat over the previous month (-0.55%) before earnings catalyst-driven volatility triggered this upward move.
Key Catalysts and Outlook to Watch
Going forward, sustaining positive investor sentiment depends on SailPoint executing against its revised full-year ARR target of $1.38 billion in upcoming quarterly reports. A key focus will be whether AI-driven security solutions maintain their ARR contribution share and continue driving new customer acquisition.
Investors will also watch whether accelerating SaaS ARR growth can lay the groundwork for a bottom-line turnaround out of negative net income territory. Ultimately, margin improvement alongside broader enterprise security software spending trends will determine long-term valuation shifts.
Data as of collection timestamp (2026-09-15T04:02:20): Price $19.88 USD · 1D 15.31% · 1W 5.63% · 1M -0.55% · 3M 35.98%
Source and Verification Timestamp
Market Data: yahoo_chart_api · Verification Timestamp: 2026-09-15T04:02:20. Related News Source: MarketBeat. Article titles serve as factual reference points; verify against official company filings and announcements for primary details.
This content is provided for informational purposes only and does not constitute investment advice or a financial recommendation.
This content is for informational purposes only and is not investment advice.
 StockBrief