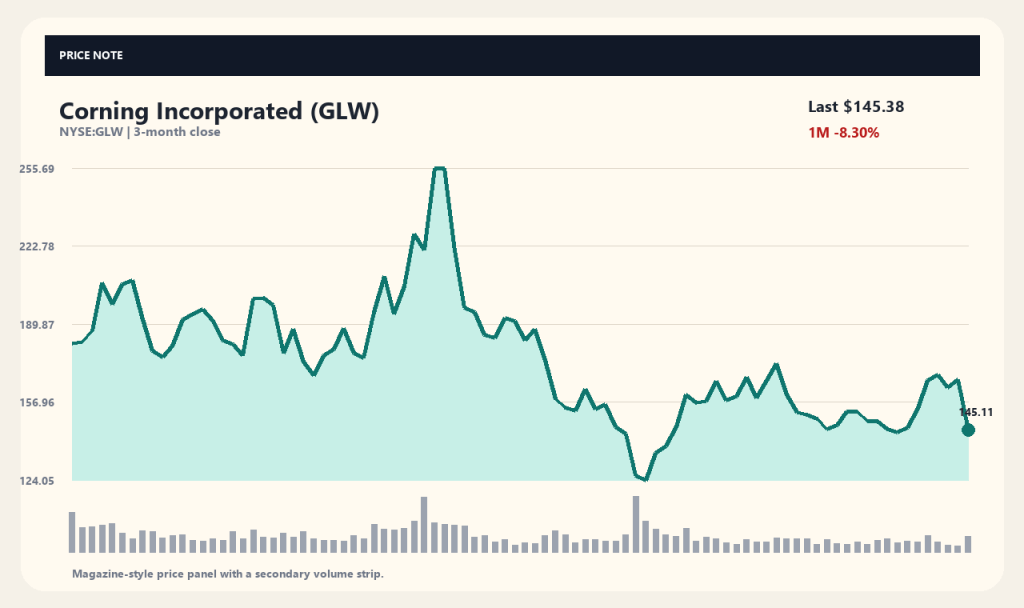
Corning (GLW) stock plummeted 12.63% in a single trading session to close at $145.38. According to reports from 24/7 Wall St. and Stocktwits, the main driver behind the steep sell-off was the company's announcement of a $2 billion At-the-Market (ATM) equity offering plan. Tumbling from its previous closing price of $166.40, the stock recorded the largest single-day loss in the S&P 500 index.
Markets interpreted the surprise new stock issuance announcement as a signal of a massive impending wave of share supply. Concerns over potential dilution of existing shareholders' equity sparked aggressive selling pressure. Additional headwinds, including broader tech sector weakness and rising 10-year Treasury yields, further exacerbated the sharp drop.
Dilution Concerns Triggered by $2 Billion Capital Raise
Corning's (GLW) decision to pursue a $2 billion equity offering stands out as the primary catalyst behind the sudden sell-off. Capital raises via ATM programs—which sell shares periodically at prevailing market prices—expand the floating share count, directly diluting existing equity holders. Reports from 24/7 Wall St. and Stocktwits noted that the surprise disclosure immediately heightened dilution worries, dampening investor sentiment right from the opening bell.
The supply overhang and liquidity absorption stemming from the offering pushed the share price down 12.63% in one day to $145.38. Adding supply bad news to a stock that had surged earlier in the year landed GLW near the bottom of the S&P 500 performance table for the session. Concerns over declining book value per share due to large-scale equity financing are expected to cap upside potential in the short term.
Optical Communications Business Base and Financing Context
Corning operates as a global technology manufacturer producing optical fiber and cables for telecommunications, glass substrates for displays, and specialty materials. Recent annual financial metrics show revenue of approximately $16.964 billion, net income of about $1.9 billion, and operating cash flow of around $3.915 billion. With cash holdings of roughly $2.504 billion against total debt of about $9.379 billion, the company's core business foundation appears stable.
The $2 billion capital raise can be interpreted as funding for business expansion, such as major capital expenditures or balance sheet strengthening. However, because specific use of proceeds and detailed disclosure filings have not been fully revealed at this stage, the market has prioritized share dilution risks over long-term growth prospects. Whether clear capital allocation plans are unveiled will serve as a key metric for assessing business impact and future price trajectories.
Short-Term Plunge and Shift in Key Chart Indicators
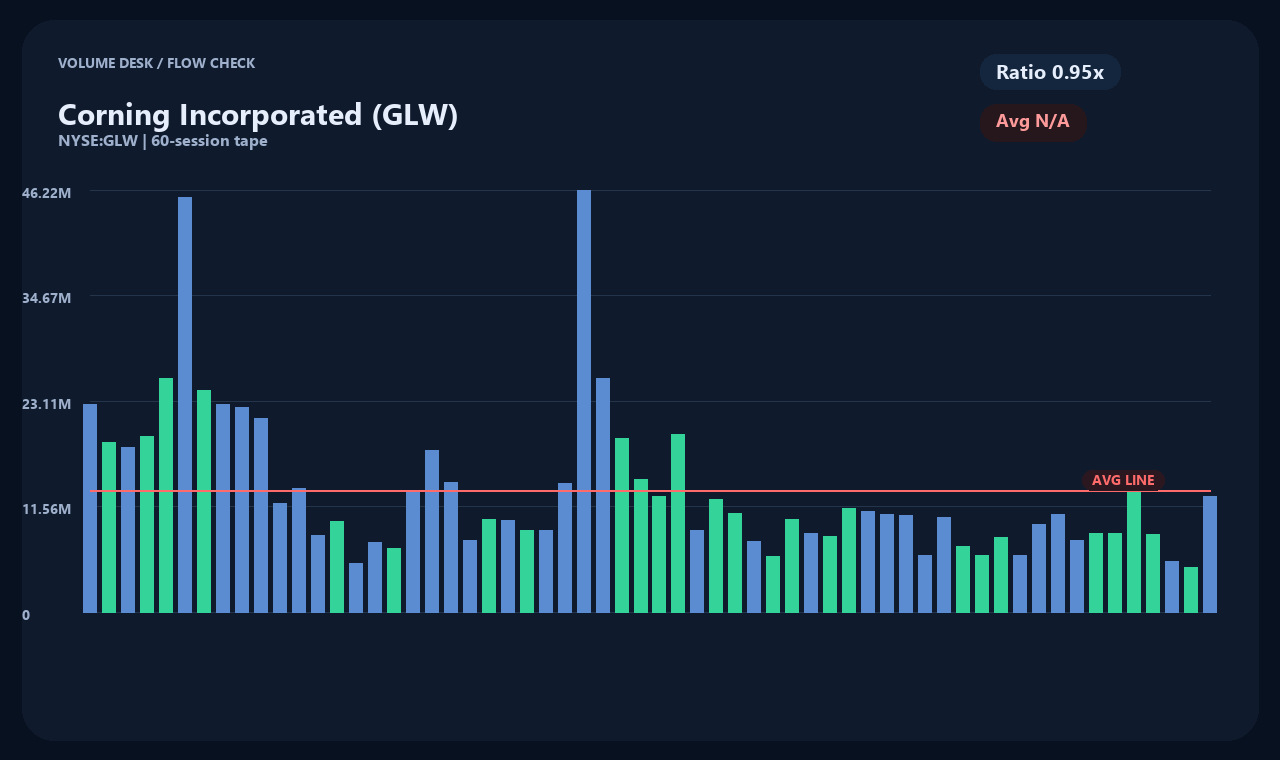
Following the 12.63% single-day crash to $145.38, Corning (GLW) saw its gap widen significantly against short-term moving averages. At the close, shares stood 5.66% below the 20-day moving average of $154.11 and 13.67% below the 60-day moving average of $168.40. Breaking sharply below the previous session's close of $166.40, the stock slid cleanly beneath key moving averages. Trading volume reached 12,546,171 shares, representing about 95% of its average volume of 13,205,325 shares.
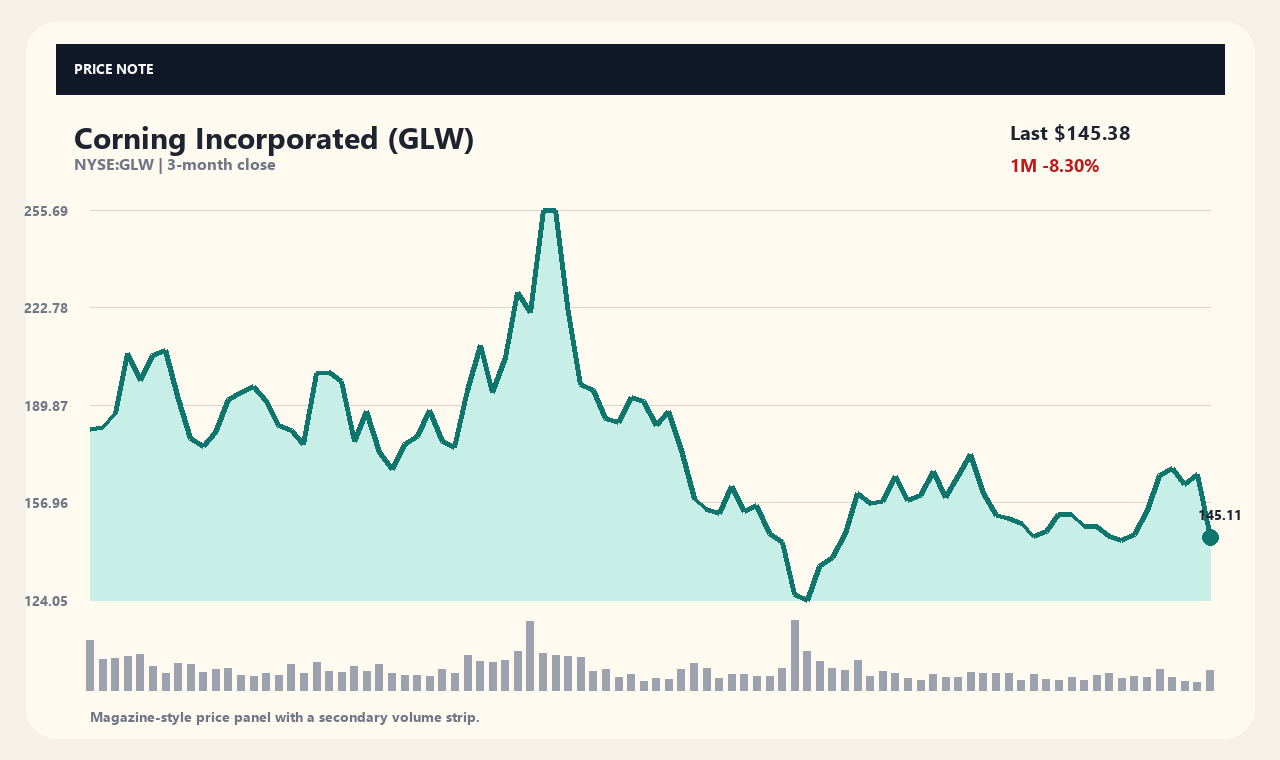
Looking at multi-period returns, GLW has experienced sustained medium- to short-term downside momentum, returning -5.78% over 1 week, -8.30% over 1 month, and -18.87% over 3 months. The stock currently sits at the 35.39th percentile of its 52-week price range between a high of $271.78 and a low of $76.15. While significantly below its 52-week high, price position alone is insufficient to predict a floor or confirm that the correction is over. As historical summary metrics, technical indicators require multi-faceted monitoring alongside volume trends and moving average convergence.
Broad Tech Volatility and Sector-Wide Weakness
US 10-year Treasury yields breaking above the 5% threshold weighed heavily on the broader equity market, particularly tech stocks. Rising market interest rates increase discount rates applied to future technology company earnings, exerting downside pressure on stock valuations. Indeed, the technology sector logged the steepest drop among all S&P 500 sectors during the session, leading to widespread selling as macroeconomic volatility expanded.
Alongside company-specific financing news, synchronized weakness across related peers was notable. According to coverage by 24/7 Wall St. and The Wall Street Journal, optical communications and networking stocks sold off broadly, with Coherent falling over 11% and Lumentum dropping more than 8%. Weakening sentiment across AI and network infrastructure companies drove sector-wide liquidations. Consequently, Corning's stock decline reflects a combination of single-company catalysts and broader tech sector volatility.
Key Factors to Watch and Valuation Assessment Criteria
The central focal point going forward will be where the $2 billion in raised capital is deployed and whether it leads to concrete margin improvements. Although equity dilution presents a short-term drag, market sentiment could pivot if the secured funds are channeled into high-ROI expansion investments or balance sheet de-leveraging. Investors will need to monitor whether this financing ultimate strengthens long-term competitive advantages.
Additionally, tracking the market's absorption rate of the new shares and verifying continued revenue growth in core segments like optical communications will be essential. Short-term price drops alone do not determine valuation, requiring a comprehensive review of specific offering terms, filing disclosures, and upcoming earnings trends. Forward-looking guidance and balance sheet shifts presented in upcoming earnings releases will act as decisive catalysts for future stock direction.
Data collected as of (2026-09-15T04:02:21): Price $145.38 USD · 1-Day -12.63% · 1-Week -5.78% · 1-Month -8.3% · 3-Month -18.87%
[Sources and Verification Timestamp]
Market data source: yahoo_chart_api · Verification timestamp: 2026-09-15T04:02:21. Related news reporting sources: MT Newswires, Barchart, Barrons.com. Article headlines serve as preliminary references; verify primary sources such as official company releases and SEC filings.
This content is provided for informational and educational purposes only and does not constitute investment advice.
This content is for informational purposes only and is not investment advice.
 StockBrief