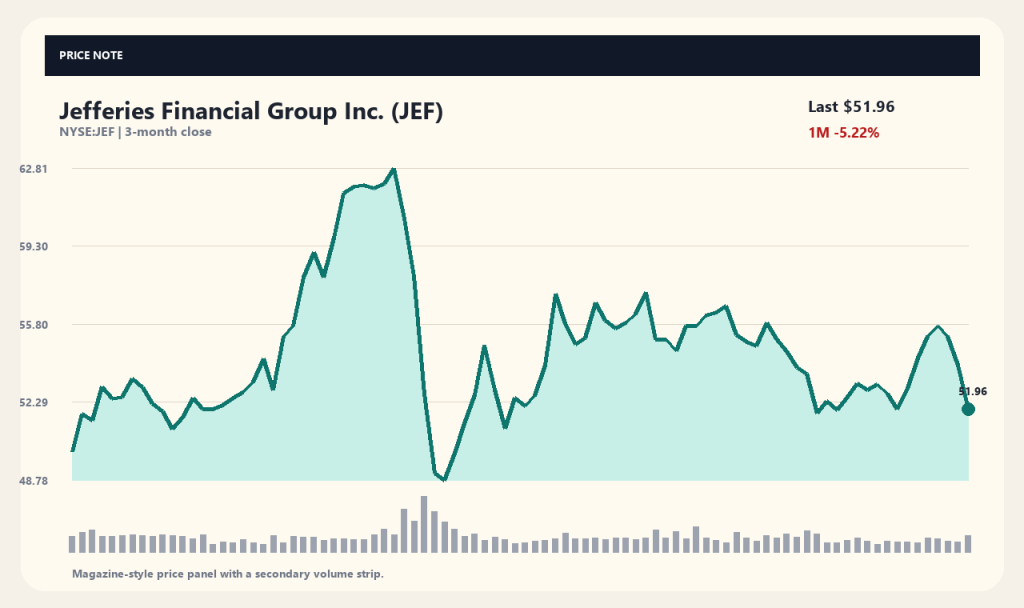
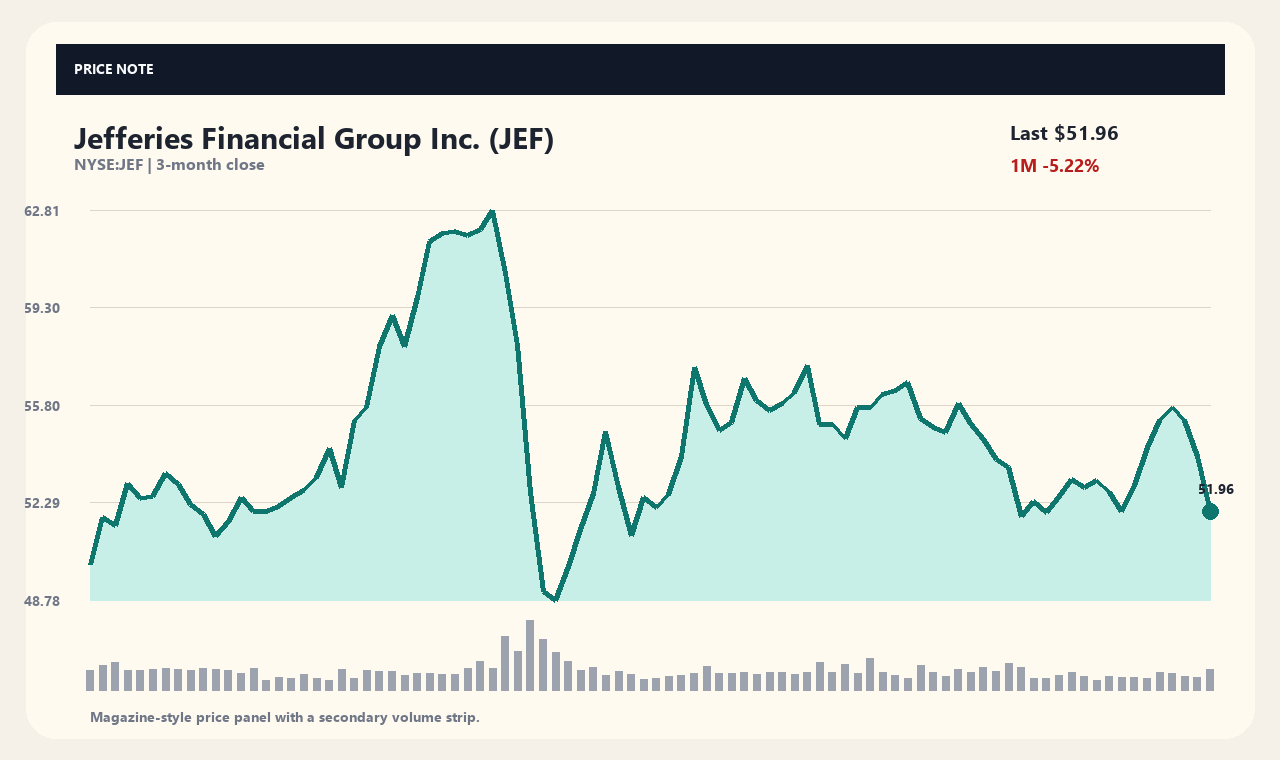
Shares of Jefferies Financial Group Inc. (JEF) closed down 3.65% at $51.96 in the latest session. The stock remains under pressure, sliding 4.24% over the past week, 5.22% over the past month, and 12.91% over the past three months.
The recent decline comes following media reports highlighting significant exposure in a fund linked to Jefferies' trade finance business. Investors are closely evaluating whether and to what extent these fund-level risks could directly impact Jefferies as the parent entity.
Trade Finance Fund Exposure Controversy
According to media reports, 'LAM Trade Finance Group II,' a trade finance fund tied to the firm, holds approximately $500 million in exposure related to specific corporate entities and founders. Reports indicate that a UK court order has frozen up to $499 million of related assets.
Investor concern is centered on whether potential defaults within the fund will transfer financial liability to Jefferies' core balance sheet. Key factors to watch include what ring-fencing protections Jefferies has in place and whether any formal loss-absorption obligations exist. At this stage, it remains unconfirmed whether these exposure risks will translate into realized losses.
Business Structure and Scale of the Global Investment Bank
Jefferies Financial Group operates primarily across two main divisions: Investment Banking & Capital Markets, and Asset Management. The firm provides a wide range of financial services, including M&A advisory, debt and equity underwriting, institutional equities trading, equity research, and asset management.
Data from Yahoo Finance shows Jefferies generating approximately $5.4026 billion in total revenue and $388.84 million in net income. Relative to the company's total market capitalization of roughly $10.56825 billion, a $500 million fund exposure represents a notable figure that could impact financial results depending on whether losses spill over to the parent company.
Moving Average Breakdown and Stock Positioning
Technical indicators show the current price of $51.96 trading 2.74% below its 20-day moving average of $53.42 and 4.80% below its 60-day moving average of $54.58. The stock has entered a weak technical posture after breaking under these short- and medium-term moving averages.
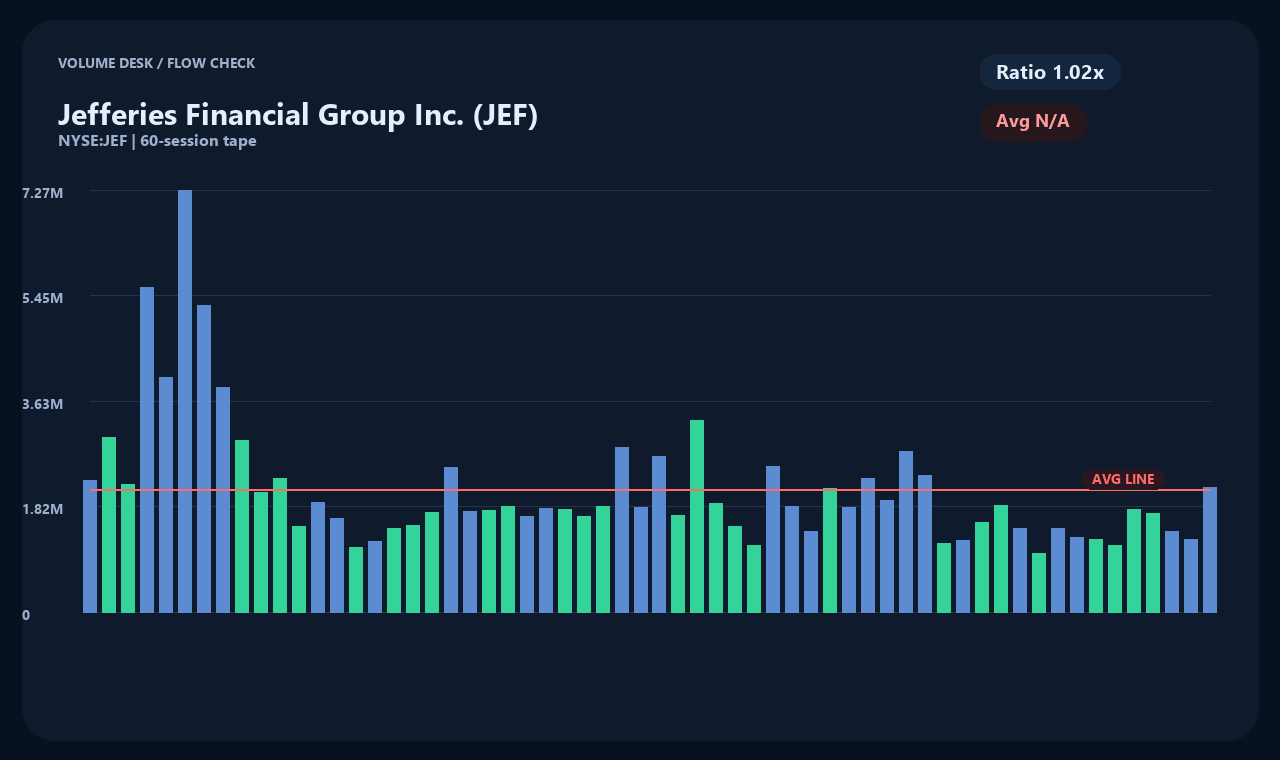
The stock currently sits at approximately 46.27% within its 52-week trading range of $35.53 to $71.04. Trading volume reached 2,143,333 shares, standing at 1.02 times its average volume and indicating no dramatic shift in trading activity. Chart levels reflect historical price action and should not be taken as a guarantee of future trajectory.
Financial Metrics and Valuation Landscape
Jefferies trades at a trailing price-to-earnings (P/E) ratio of approximately 14.51x, with TTM earnings per share (EPS) of $3.58. Recent quarterly performance showed solid underlying growth, with revenue increasing 35% and net income rising roughly 159.8% year-over-year.
The firm holds approximately $62.6259 billion in cash and cash equivalents against total liabilities of about $38.6933 billion, reflecting the large asset-and-liability footprint typical of major financial institutions. Despite strong underlying earnings growth, external headwinds surrounding the affiliated fund continue to weigh on shares.
Key Factors That Could Shift the Narrative
Determining the future path of Jefferies stock requires clarity on whether actual losses occur at the fund level and the precise legal and financial scope of Jefferies' liability. If parent-level ring-fencing holds firm and prevents direct asset contagion, market concerns should subside.
Conversely, if Jefferies is obligated to absorb part or all of the fund losses, downside earnings revisions are likely to follow. Investors should monitor upcoming official announcements and quarterly filings for potential loss provisioning.
Data collected as of (2026-09-14T04:04:02): Price $51.96 USD · 1-Day -3.65% · 1-Week -4.24% · 1-Month -5.22% · 3-Month -12.91%.
Sources and Verification Timestamp
Market data: yahoo_chart_api · Verification timestamp: 2026-09-14T04:04:02. Related reporting sources: Stocktwits, MT Newswires, Barrons.com. Article headlines serve as preliminary facts; primary sources such as company press releases and official regulatory filings should be independently verified.
This content is provided solely for informational purposes and does not constitute investment advice or a solicitation to buy or sell securities.
This content is for informational purposes only and is not investment advice.
 StockBrief