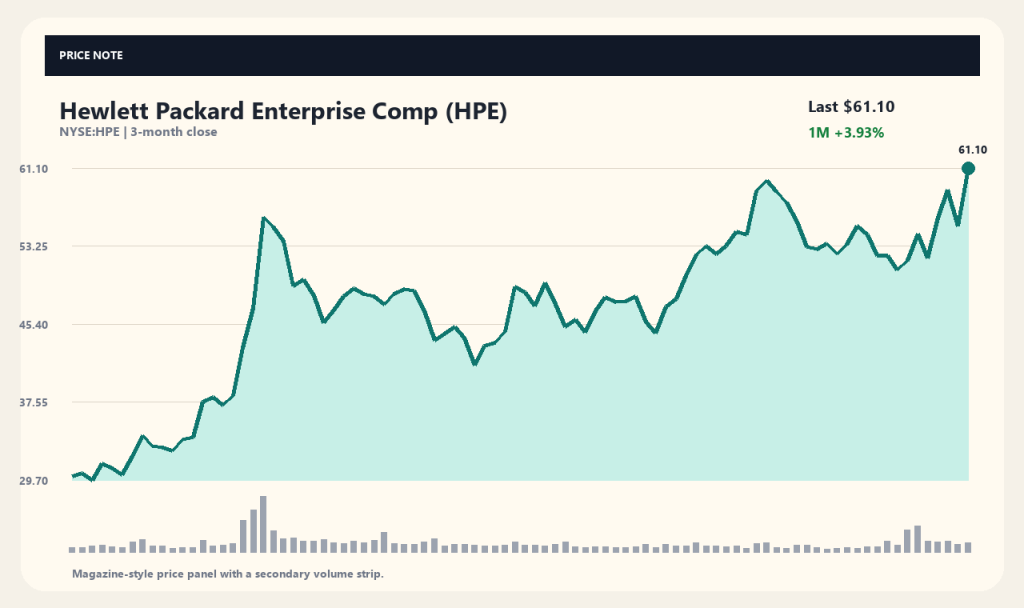
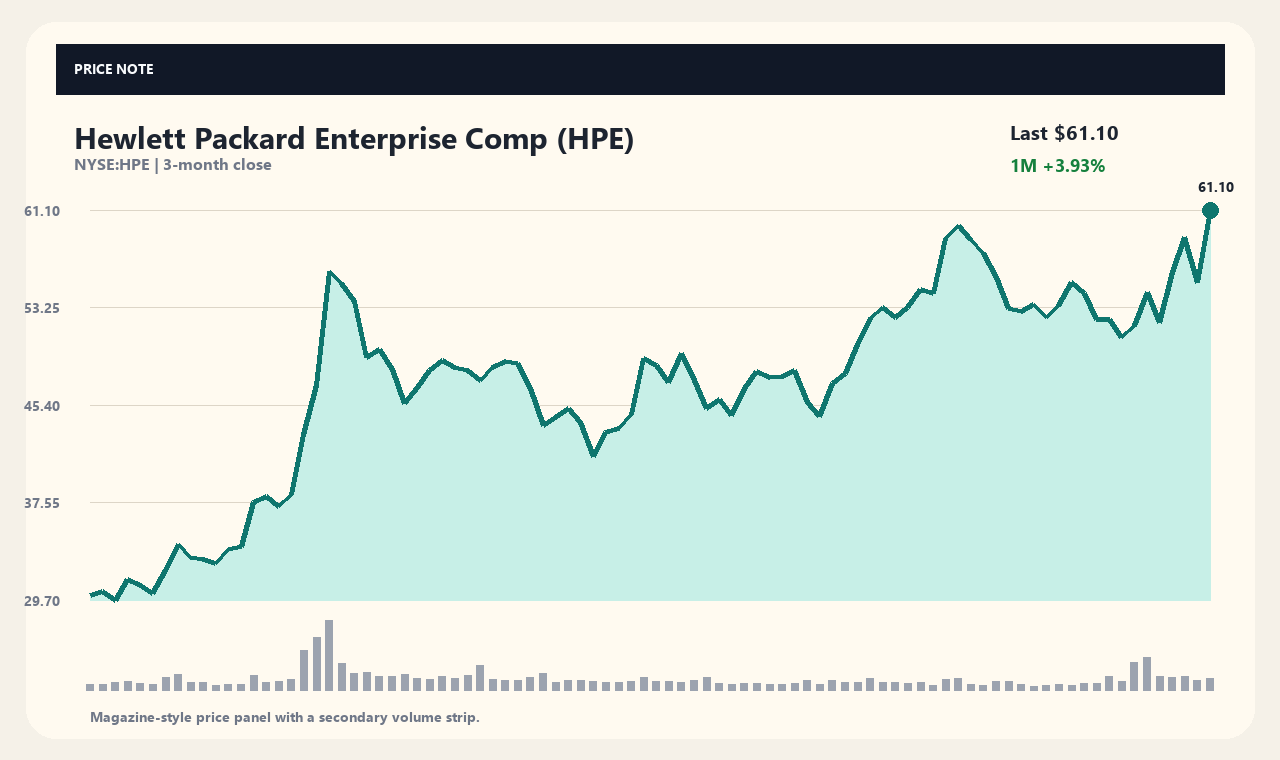
According to data collected on September 12, 2026, Hewlett Packard Enterprise (HPE) shares closed at $61.10, up 10.65% from the previous trading session. The stock rose sharply from its prior close of $55.22, breaking out above its recent trading range.
The primary catalyst behind the rally was news of expanding AI data center capital expenditures across major Big Tech firms. Reports from Barrons.com and Stocktwits highlighted Oracle's $95 billion capex plan, driving market expectations of increased demand for data center servers and networking equipment supplied by Hewlett Packard Enterprise.
Big Tech Capex Surge Drives Data Center Hardware Demand
Oracle's massive capex announcement signaled to the market that AI infrastructure buildouts remain in full swing. Consequently, major server and hardware manufacturers posted strong gains. GuruFocus.com and Barrons.com reported that shares of Dell Technologies and Hewlett Packard Enterprise helped lead gains in the S&P 500 following Oracle's release.
Hewlett Packard Enterprise specializes in general-purpose servers as well as high-performance computing, AI-optimized servers, and hybrid cloud solutions. Accelerated infrastructure spending by Big Tech increases the likelihood of rising orders for high-performance servers and networking hardware. Expectations of expanding upstream demand served as the main driver behind the stock's surge.
Evaluating HPE's Financial Profile and Market Positioning
Based on Yahoo Finance data, Hewlett Packard Enterprise generated annual revenue of approximately $41.871 billion and net income of around $2.675 billion. Revenue grew by 33.7% while net income jumped 410.2%, reflecting solid recent annual performance. Operating cash flow stood at approximately $6.694 billion, maintaining stable cash generation capabilities.
However, total debt reached approximately $20.321 billion, significantly exceeding its cash holdings of about $6.216 billion—a factor worth monitoring. Additionally, the stock trades at a trailing price-to-earnings (P/E) ratio of 31.48x with a net profit margin of 6.67%. Whether rising data center demand translates into long-term margin expansion remains a key valuation metric.
Stock Performance and Volume Analysis
The closing price of $61.10 marks a significant advance from its 52-week low of $19.84, placing the stock at approximately 92.91% of its 52-week high of $64.25. Technical moving averages show the stock trading 11.91% above its 20-day moving average ($54.60) and 21.39% above its 60-day moving average ($50.33), demonstrating powerful short-term momentum.
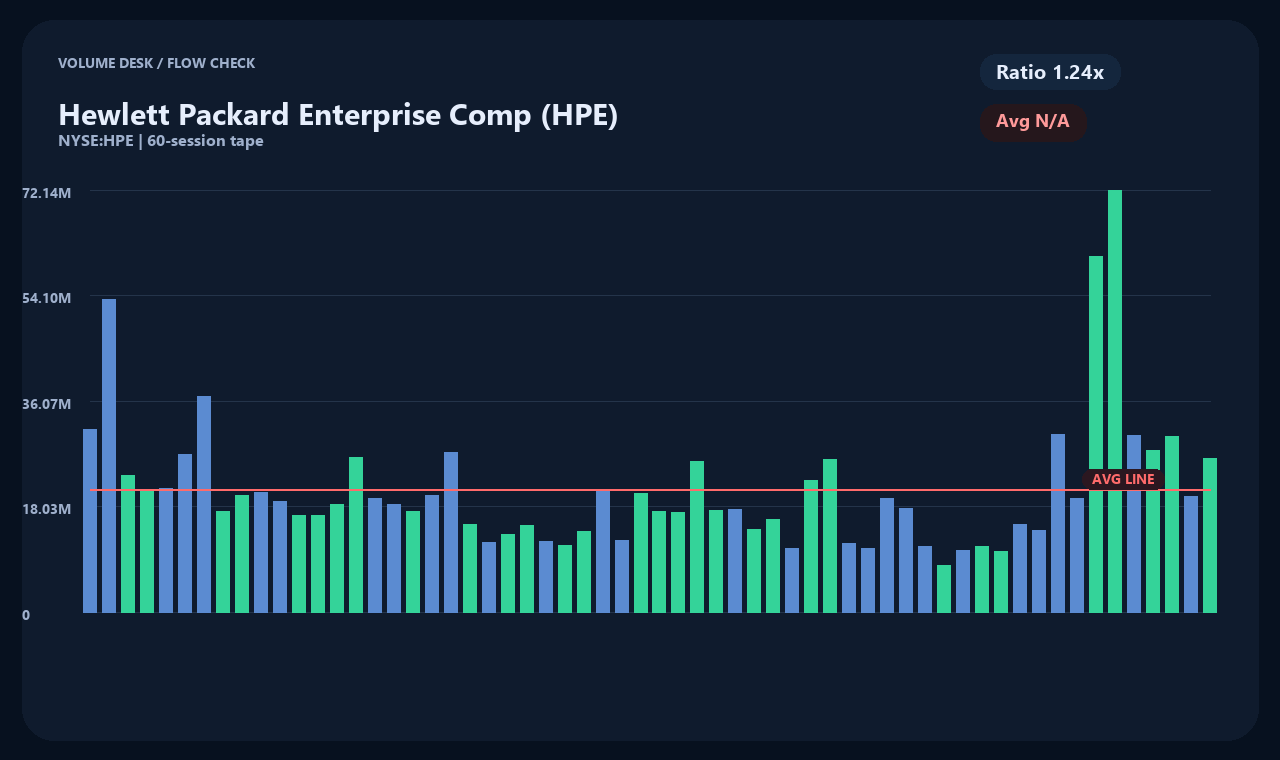
Recent returns show gains of 12.23% over 1 week, 3.93% over 1 month, and 30.56% over 3 months. Daily trading volume exceeded 26.12 million shares, roughly 1.24 times its average volume. While this reflects active trading response to a major catalyst, the extended gap above key moving averages raises the potential for near-term volatility.
Market Optimism and Current Analytical Limitations
Optimism surrounding the AI hardware boom, fueled by financial media coverage, acted as an immediate catalyst driving the stock upward. Market sentiment benefited from expectations that elevated spending by major cloud and data center operators will translate into growing order backlogs for server manufacturers.
However, current media reports primarily reflect initial market reactions to headlines rather than official regulatory filings confirming specific new contract wins or order values for Hewlett Packard Enterprise. The extent to which Big Tech capex plans, such as Oracle's, convert into actual orders and revenue for HPE will need to be verified in upcoming quarterly earnings releases.
Key Factors and Catalysts to Watch Ahead
Future stock performance will hinge on how effectively Big Tech AI infrastructure demand translates into top-line growth for HPE's server and hybrid cloud segments. In particular, order backlog trends in high-performance AI servers and average selling price (ASP) improvements will serve as critical indicators of execution.
Furthermore, investors should monitor the company's ability to manage its $20.3 billion debt load and expand operating margins amid high interest rates and fluctuating input costs. Given that market enthusiasm has pushed the stock near its 52-week high, upcoming quarterly financial results and management guidance must match market expectations to sustain momentum.
Timestamp Data (2026-09-12T04:04:10): Price $61.10 USD · 1D +10.65% · 1W +12.23% · 1M +3.93% · 3M +30.56%
[Sources and Verification Timestamp]
Market Data: yahoo_chart_api · Timestamp: 2026-09-12T04:04:10. News Sources: Reuters, GuruFocus.com, Stocktwits. Article headlines serve as initial references; investors should verify details against official corporate announcements and regulatory filings.
This content is for informational purposes only and does not constitute investment advice.
This content is for informational purposes only and is not investment advice.
 StockBrief