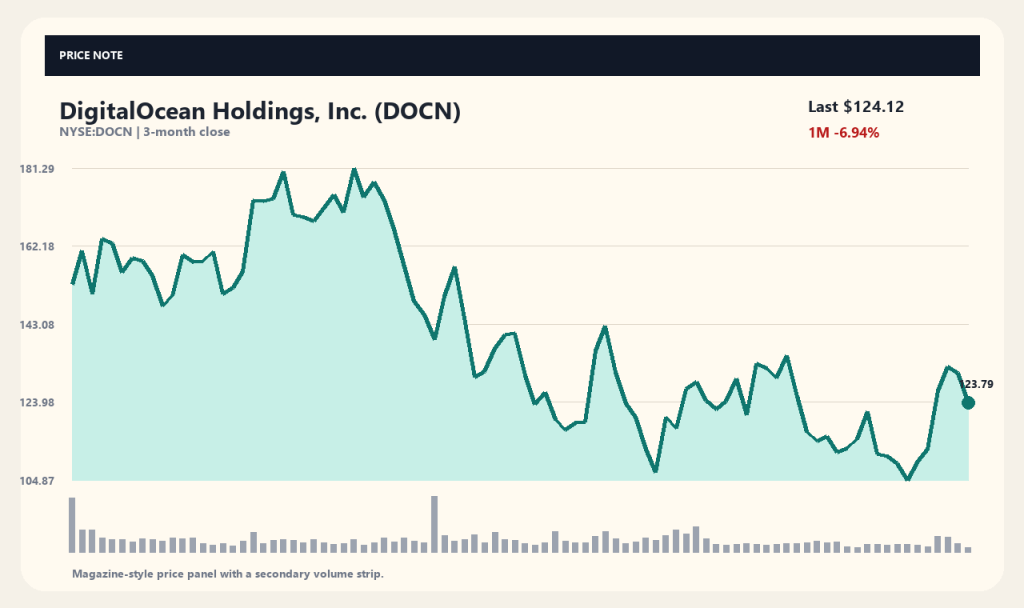
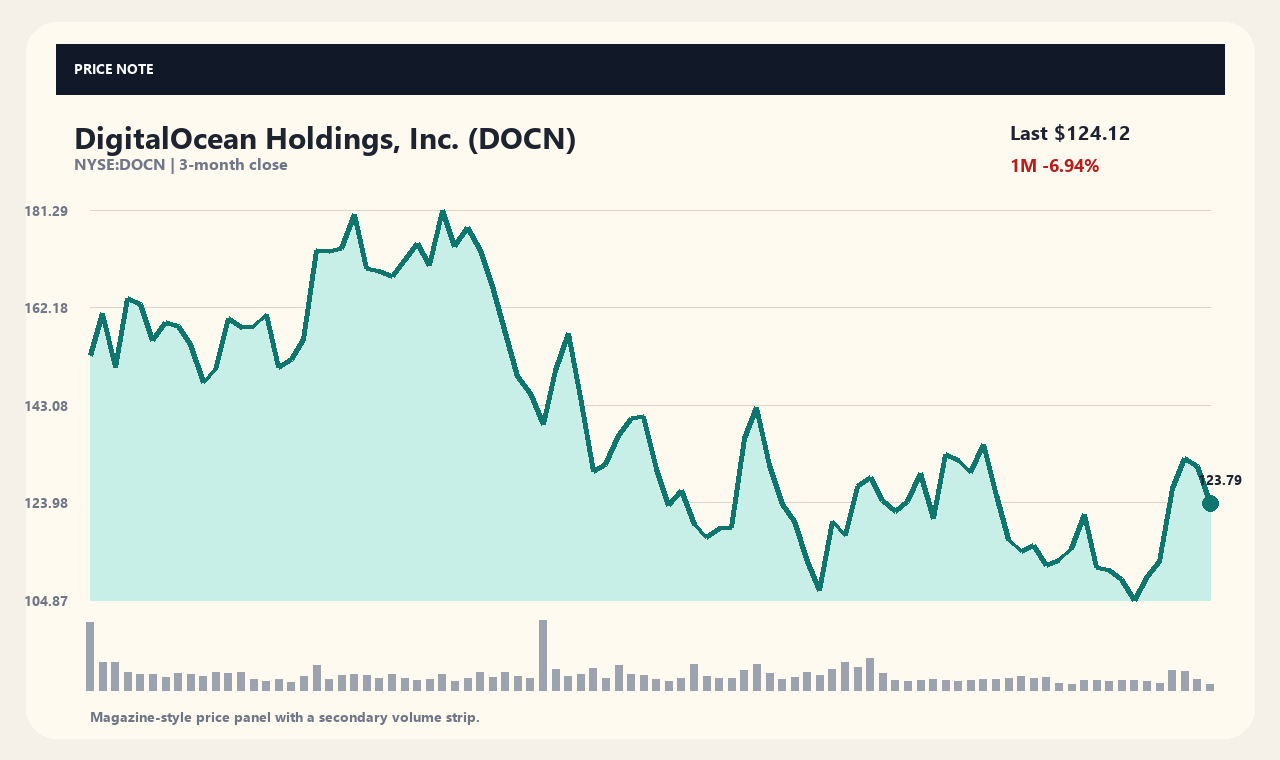
Shares of cloud infrastructure provider DigitalOcean Holdings (DOCN) fell 5.29% in a single session to close at $124.12. Despite a recent 1-week gain of 13.46%, the stock remains down 28.97% over the past three months. Investors are weighing optimism around its artificial intelligence growth prospects against recent insider selling disclosures by top executives.
The pullback follows DigitalOcean's presentation at a Goldman Sachs conference and a series of SEC insider sale filings. News that Chief Executive Officer Padmanabhan Srinivasan and the Chief Financial Officer sold shares drew significant market attention, shifting the focus to whether the company's AI-centric transformation will deliver long-term profitability.
AI Cloud Strategy Announcement and Revenue Growth
DigitalOcean gained market attention after outlining a cloud strategy centered on AI inference workloads at the Goldman Sachs conference. According to Q2 earnings released in August, revenue rose 29% year-over-year to $281 million. Citing sustained momentum, the company raised its full-year guidance.
This top-line growth rate marks one of the strongest paces in recent years, propelled by surging demand for AI and machine learning infrastructure. Trailing 12-month revenue reached approximately $1.01111 billion with net income of $235.24 million, though shifting cost structures from expanded AI investments could impact future cash flows.
Executive Share Disclosures and Market Impact
According to a recent Motley Fool report, the CFO sold roughly 35,000 shares worth around $3.8 million. CEO Padmanabhan Srinivasan sold 20,483 shares totaling approximately $2.2 million. A portion of the CEO's sales was executed to cover tax obligations from restricted stock unit (RSU) vesting, while the remainder was executed under a pre-established Rule 10b5-1 trading plan.
Following the transaction, the CEO retains 762,817 shares valued at approximately $83.45 million. While executive stock sales often stem from pre-arranged trading plans, they can exert short-term pressure on market sentiment, making it essential to assess the sales alongside remaining equity stakes.
Technical Indicators and Moving Average Breakdown
At $124.12, the stock currently trades 4.74% above its 20-day moving average of $118.50, but stands 3.51% below its 60-day moving average of $128.63. This positioning highlights a crossover point between short-term momentum and a medium-term downtrend.
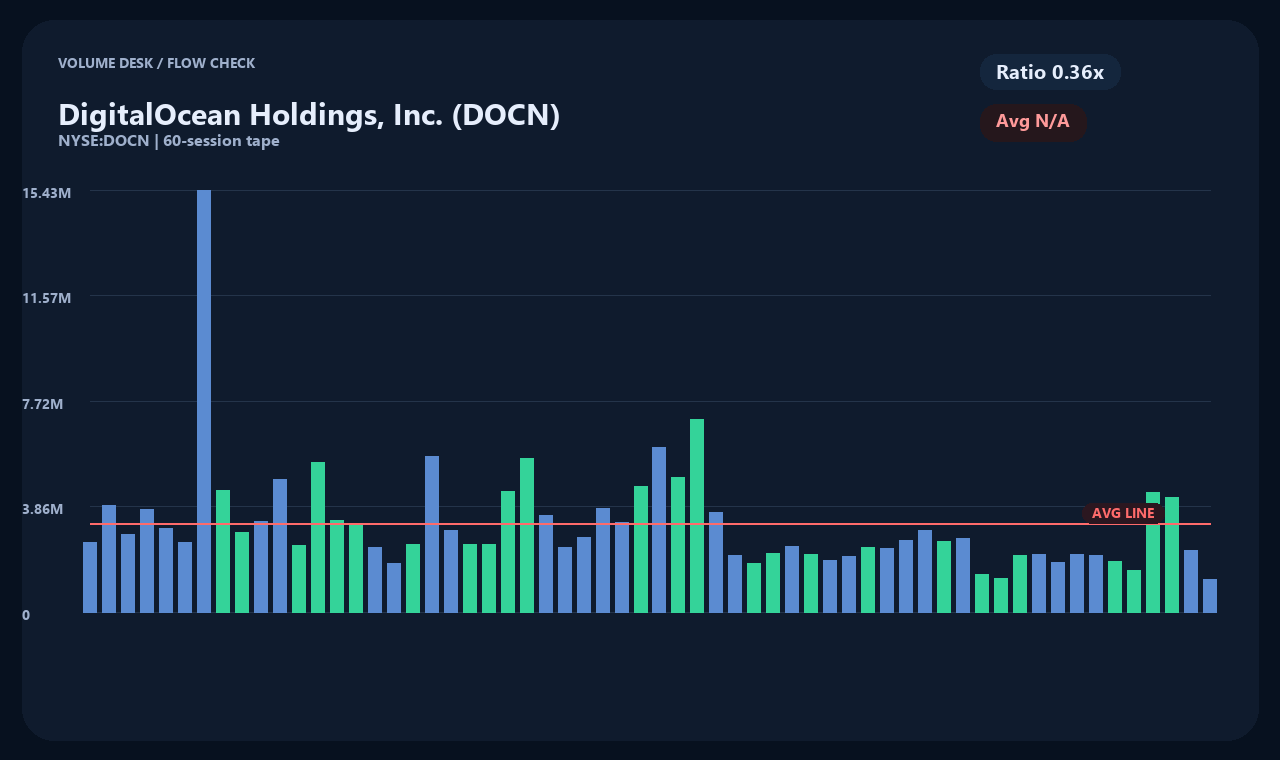
The stock trades at roughly 58.79% of its 52-week range ($33.69 to $187.50). Daily trading volume registered at 1.180695 million shares, reaching just 36% of its average daily volume of 3.2372 million shares. The price decline on light volume indicates market hesitation rather than heavy institutional selling.
Analyst Coverage and Key Financial Metrics
Shares experienced brief downward pressure after Truist Securities initiated coverage on DigitalOcean. According to Simply Wall St, the stock moved lower on the day coverage opened. New analyst coverage frequently triggers a re-evaluation of corporate valuation, increasing near-term price volatility.
On the valuation front, DigitalOcean trades at a price-to-earnings (P/E) ratio of approximately 56.27. While revenue growth remained solid at 28.6%, earnings growth has decelerated. Balance sheet metrics show cash holdings of $767.02 million against total debt of $1.97785 billion, keeping debt management under investor scrutiny.
Key Catalysts and Investment Outlook
DigitalOcean's future stock trajectory hinges on sustained revenue expansion across its AI cloud services. Investors will monitor upcoming quarterly earnings to track AI revenue contributions and operating margin expansion, alongside the company's ability to balance capital investments with debt service.
Additional insider transactions and consensus price target revisions will remain key tracking factors. Whether valuation multiples ease to more attractive entry levels depends heavily on DigitalOcean delivering against its updated financial guidance over the medium-to-long term.
Data captured as of (2026-09-12T04:04:11): Price 124.12 USD · 1-Day -5.29% · 1-Week 13.46% · 1-Month -6.94% · 3-Month -28.97%
[Sources and Timestamps]
Market Data: yahoo_chart_api · As of: 2026-09-12T04:04:11. News Sources: StockStory, Insider Monkey, Simply Wall St. Headline references serve as context; confirm primary company filings and press releases for verification.
This article is provided for informational purposes only and does not constitute investment advice.
This content is for informational purposes only and is not investment advice.
 StockBrief