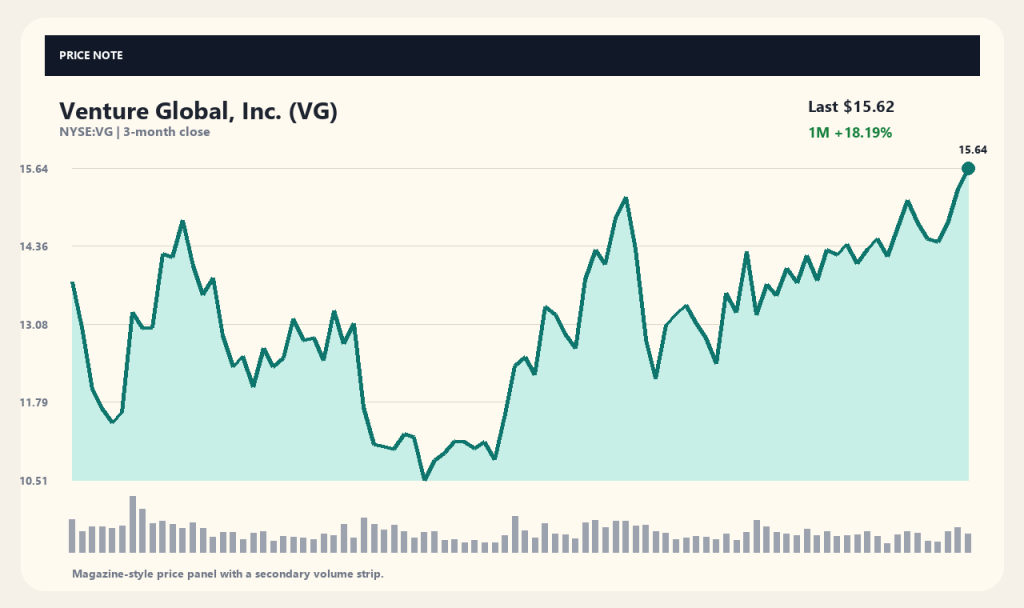
Shares of Venture Global, Inc. (VG), a U.S. liquefied natural gas (LNG) producer, have demonstrated a clear upward trend recently. As of September 11, 2026, the stock traded at $15.62, up 2.19% from the previous trading day and up 18.19% over the past month. Investors are evaluating whether raised full-year guidance following Q2 earnings and the acceleration of its LNG operations are driving the stock price movement.
The company carries massive capital expenditures and high debt levels as it builds out LNG production infrastructure and expands export operations. For investors, a key question remains whether the recent stock bounce reflects genuine operational performance and whether this growth rate can be sustained under a heavy debt load. Examining key financial metrics and media reports provides helpful context on the company's status.
Q2 Earnings Performance and Upward Full-Year Guidance Revision
According to media coverage from Insider Monkey, Venture Global raised its full-year 2026 consolidated adjusted EBITDA guidance from $8.2 billion–$8.5 billion to $8.7 billion–$9.1 billion following its Q2 earnings release. Management increased its annual target as operational momentum visible from production volume expansions materialized. Zacks also reported that Wall Street earnings estimates have trended upward rather than downward following the earnings announcement.
Raising full-year expectations indicates that its LNG projects, operations, and commercial production are progressing without significant hitches. Revenue reached approximately $16.951 billion, sustaining top-line expansion. However, estimates like the EBITDA projections reported in news outlets remain subject to shifting market conditions, underscoring the need to track official quarterly results as they are reported.
Structural Features of Midstream LNG Infrastructure Operations
Venture Global develops large-scale LNG projects, including Calcasieu, Plaquemines, and CP2. Beyond operating liquefaction facilities, the company runs integrated operations covering gas transportation, regasification, and sales and deliveries using dedicated LNG carriers. This business structure remains directly exposed to energy price volatility and shipping efficiencies.
According to corporate summary data, the company recently reported net income of roughly $3.331 billion, with a net margin of 22.05%. Operating cash flow reached $6.829 billion, but heavy capital expenditure investments pushed free cash flow to negative $8.635 billion. This highlights the substantial capital deployments required during its infrastructure expansion phase.
Heavy Debt Burden and Capital-Intensive Structural Limits
A look at the balance sheet shows total debt of $42.835 billion against cash and cash equivalents of $3.151 billion. Given the capital-intensive nature of constructing large LNG liquefaction terminals, the company relies heavily on external borrowing. High debt levels could present financial pressure if interest rates fluctuate or commodity prices drop.
The stock currently trades at a price-to-earnings (P/E) ratio of about 11.94x, with earnings per share (EPS) at $1.31. Even with solid operating cash flow generation, a dynamic where capital expenditure demands outstrip cash generation capacity could persist over the long term. Debt repayment schedules and completion timelines for new projects serve as pivotal variables for financial stability.
Price Trends and Recent Volatility Analysis
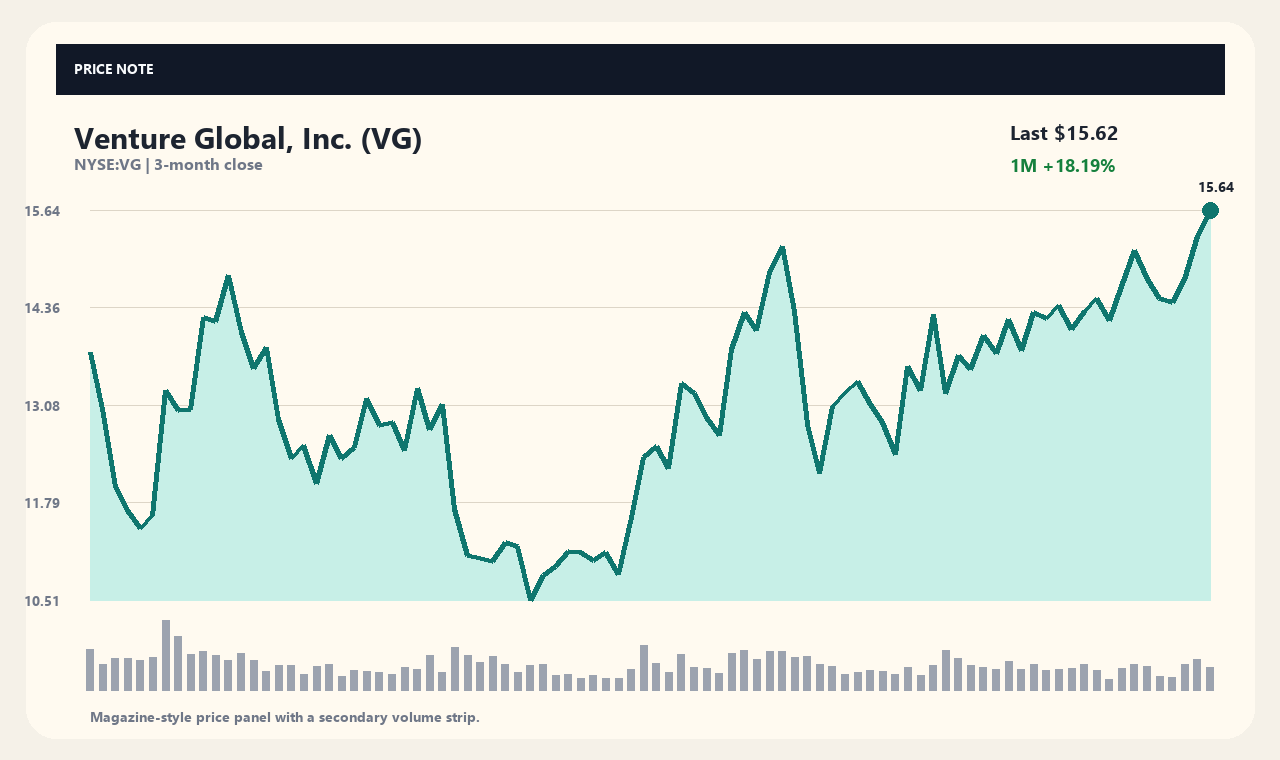
The stock has rebounded significantly from its 52-week low of $5.72, currently trading at 83.24% of its 52-week high of $17.62. The equity exhibits short-term bullish momentum, trading 8.43% above its 20-day moving average ($14.41) and 18.70% above its 60-day moving average ($13.16). The stock posted a 6.08% gain over the past week and a 17.57% gain over the past three months.
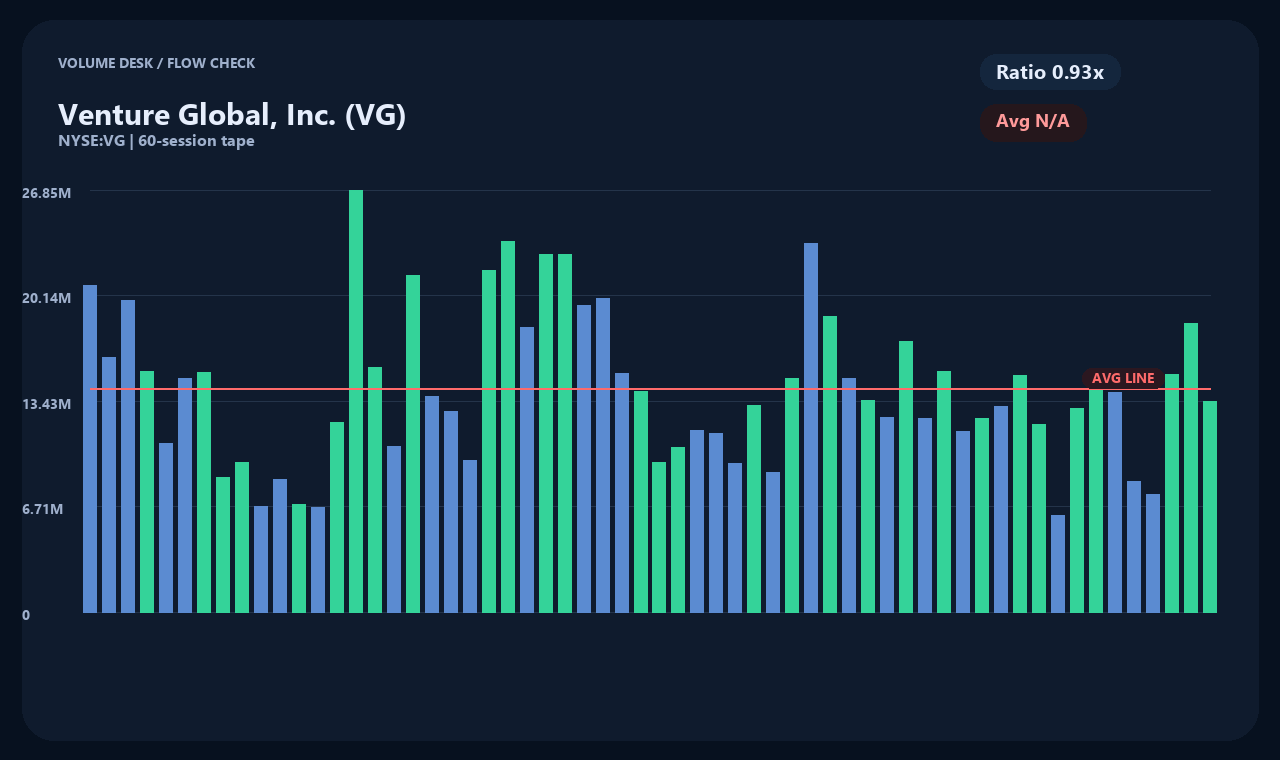
Daily trading volume reached 13,364,392 shares, representing roughly 93% of its average volume (14,435,604 shares). The stock advancing above its moving averages without a massive volume spike suggests an ongoing continuation of its existing uptrend. However, historical price metrics merely summarize past performance and do not guarantee future gains or establish price floors.
Key Variables to Watch and Analytical Limitations
To gauge Venture Global's trajectory going forward, investors must monitor whether the raised EBITDA target translates into actual quarterly performance. Key factors to track include global natural gas supply-demand dynamics, crude oil price movements, and whether large-scale projects achieve completion and commercial operations on schedule. Managing debt service while improving free cash flow profile will also remain critical.
Media reports and Wall Street estimates reflect media summaries compiled at the time of publication, making it essential to verify details against official future regulatory filings. Rather than focusing solely on short-term rallies, investors should evaluate the underlying risk factors and balance sheet profile inherent to capital-intensive LNG infrastructure projects.
Data collection snapshot (2026-09-11T04:02:49): Price $15.62 USD · 1-Day +2.19% · 1-Week +6.08% · 1-Month +18.19% · 3-Month +17.57%
[Sources and Verification Timestamp]
Market Data: yahoo_chart_api · Timestamp: 2026-09-11T04:02:49. Related Media Sources: Related media coverage requires additional verification. Article titles serve as reference pointers, and underlying facts should be cross-referenced against primary company disclosures and press releases.
This content is provided strictly for informational purposes and does not constitute investment advice.
This content is for informational purposes only and is not investment advice.
 StockBrief