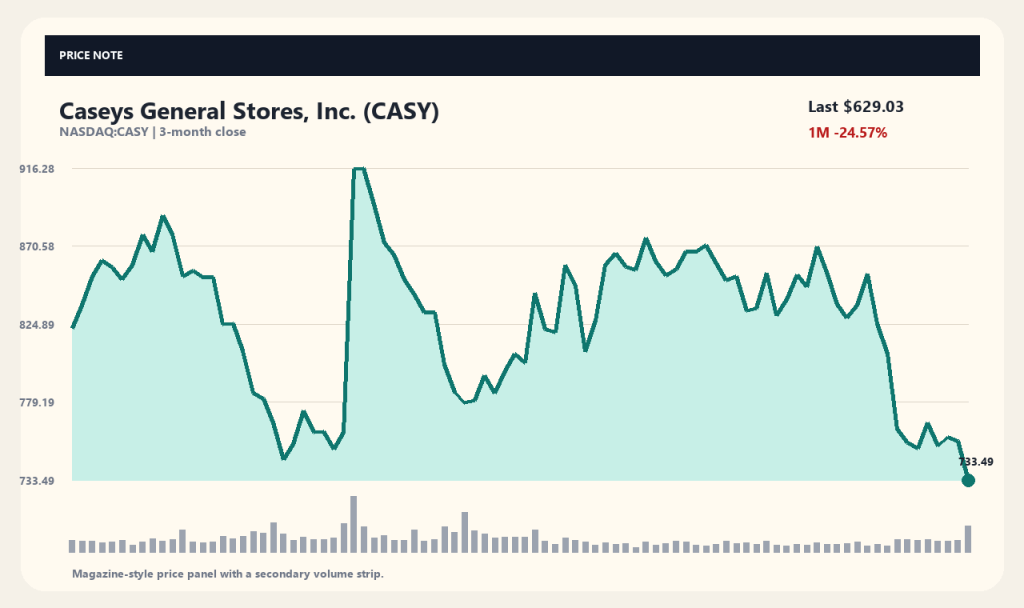
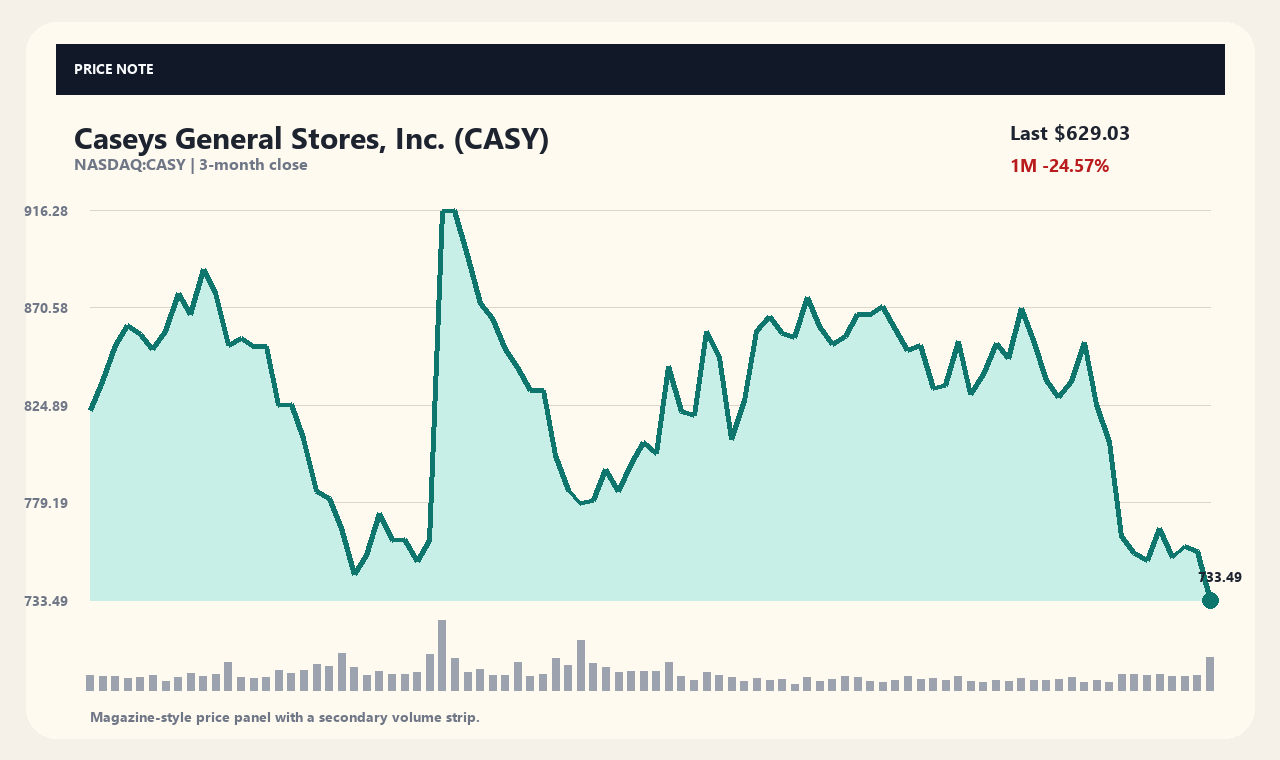
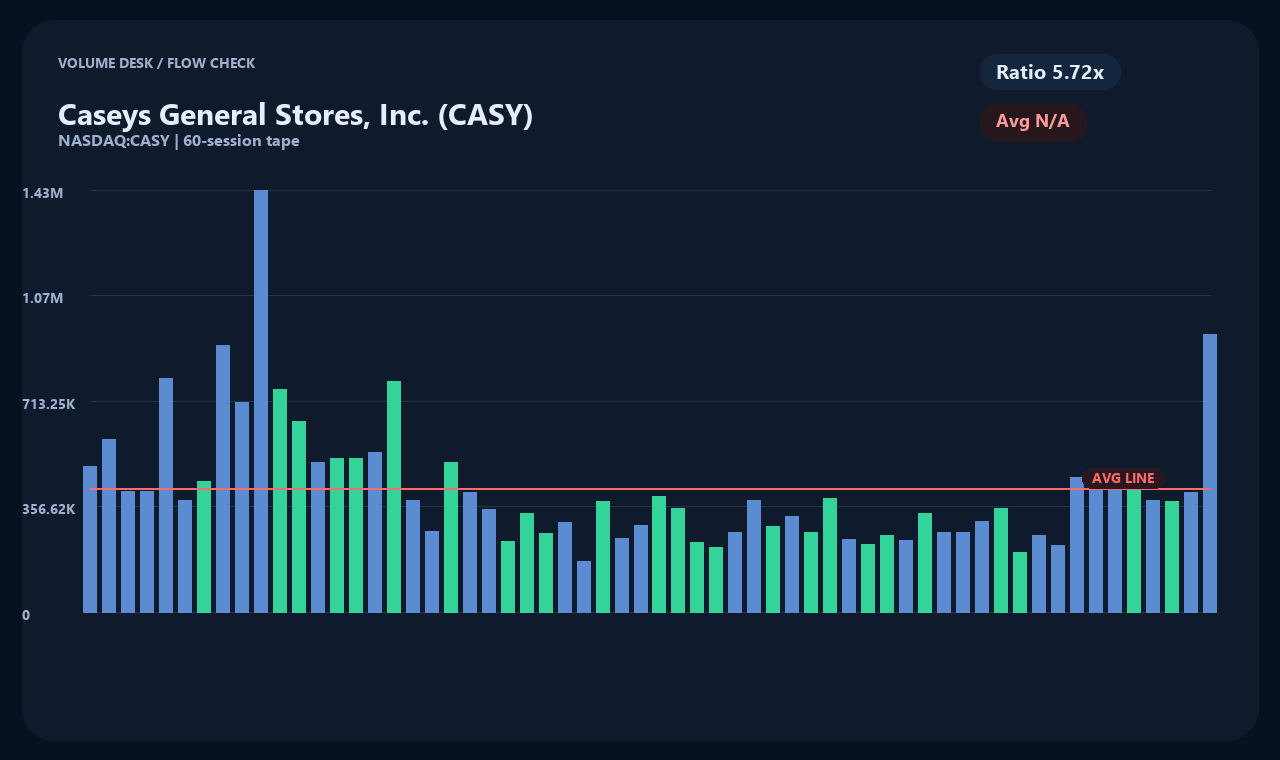
Shares of Casey's General Stores (CASY) tumbled 14.24% in a single session to close at $629.03, even after reporting solid growth for Q1 fiscal 2027. Trading volume surged to over 2.57 million shares—roughly 5.7 times its daily average. Despite positive results including a 28% year-over-year jump in earnings per share, investors are scrutinizing what triggered such a sharp market pullback.
Following the drop, the stock is down 24.57% over the past month, trading 21.96% below its 20-day moving average. This disconnect between strong operating performance and negative price action highlights the need to look beyond headline figures to elevated valuation expectations and broader consumer sector pressures.
Q1 Earnings Growth and Key Operational Metrics
In its Q1 fiscal 2027 earnings release, Casey's reported a 28% year-over-year increase in EPS, while net income climbed 27% according to reports from Motley Fool and GuruFocus. Top-line expansion and profitability were primarily fueled by robust fuel margins and increased inside sales, particularly within its prepared food segment.
Insider Monkey reported that same-store sales grew 3.2% year-over-year, bringing two-year stacked growth to 7.7%, while inside margin reached 42.2%. Financial outlets view these operational metrics as early proof that the company's three-year strategic plan and major store remodeling initiatives are paying off.
Unpacking the Post-Earnings Sell-Off
Despite the strong report, Casey's stock dropped 14.24% in a single day, falling from $733.49 to $629.03. Barrons.com noted that following a run-up ahead of the release, market expectations had risen far beyond a simple earnings beat. This suggests the positive results were already priced in, triggering profit-taking immediately after the announcement.
Macroeconomic headwinds across the broader consumer sector also weighed on performance. Rising crude oil prices, spiking Treasury yields, and geopolitical tensions in the Middle East dampened overall market sentiment. As consumer discretionary and staple indexes faced selling pressure, CASY experienced heightened downside momentum from both macro trends and a "sell-the-news" reaction.
Technical Trends and Price Action Breakdown
Closing at $629.03 after the 14.24% drop, CASY brings its one-week decline to 16.38% and its one-month loss to 24.57%. The stock is now trading 30.58% below its 52-week high of $927.85.
Moving average gaps have widened significantly. Shares now sit 21.96% below the 20-day moving average of $806.01 and 23.98% below the 60-day moving average of $827.42. Daily volume skyrocketed to approximately 2.58 million shares, representing a 5.72x surge over the baseline average of about 450,000 shares.
Financial Position and Fundamental Health
Financial data shows Casey's generating annual revenue of $18.67 billion and net income of $772.81 million. The business maintains solid cash generation capabilities, delivering operating cash flow of $1.39 billion and free cash flow of $501.95 million. Top-line growth stood at 24.3% with net income expanding 27.7%, confirming growth in both scale and profitability.
However, balance sheet metrics show total debt of $2.89 billion against $524.05 million in cash reserves. Trading at a trailing 12-month P/E ratio of 32.83 based on EPS of $19.16, the stock carried a valuation premium going into the report. Investors will be watching how effectively ongoing operating cash flows cover long-term debt servicing and capital expenditures.
Key Catalysts and Factors to Watch
Looking ahead, sustaining fuel margins and inside food sales will be critical for CASY. With Q1 fiscal 2027 delivering 3.2% same-store sales growth and a 42.2% inside margin, the key question is whether these high-margin metrics can persist. Future quarterly reports will show whether CEFCO store remodels and the three-year expansion plan drive lasting unit volume growth.
Investors should also monitor crude oil volatility stemming from geopolitical risks and its effect on retail fuel margins. High fuel costs and elevated interest rates could press consumer spending, potentially dampening foot traffic and same-store sales. While the stock has pulled back 30% from its highs, assessing true value requires monitoring cash flow durability alongside the management of its $2.8 billion debt load.
Data as of (2026-09-10T10:35:48): Price $629.03 USD · 1D -14.24% · 1W -16.38% · 1M -24.57% · 3M -16.31%
[Sources and Timestamps]
Market Data: yahoo_chart_api · Timestamp: 2026-09-10T10:35:48. News Sources: Motley Fool, Insider Monkey, GuruFocus.com. Article headlines serve as factual reference clues; verify against primary company disclosures and filings.
This content is provided for informational purposes only and does not constitute investment advice.
This content is for informational purposes only and is not investment advice.
 StockBrief